For each CSIRO Mk3.0 gridcell: An average precipitation was calculated for 1961-1990 based on the simulated transient historical data. Result is a 12 month simulated climatology at the scale of the CSIRO Mk3.0 grid.
For each forecast month a ratio anomaly was calculated (ex. January_2021 / Mean_historical_January). Anomalies were capped at 5.0. Result is a 100 year monthly set of precipitation anomalies at the scale of the CSIRO Mk3.0 grid.
For each forecast month: Gridded anomalies were interpolated to a ½ degree grid using a bilinear interpolation. For each forecast month and each ½ degree gridcell: The anomaly for that month is mulitplied to the CRU historical precipitation (ex. CRU_Mean_January_1961-1990 x January_2021_anomaly). Result is monthly precipitation data for the years 2001-2100 at the ½ degree grid.
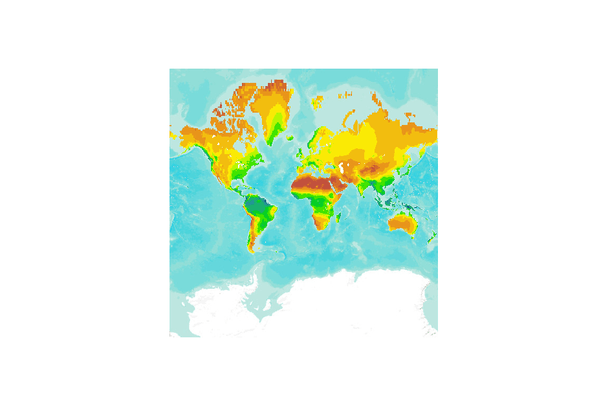
An average of the years 2070-2099 was produced. Result is a single map of the average sum annual precipitation values.