Filters: Types: Citation (X) > Tags: {"type":"Theme","name":"usgs"} (X)
11,820 results (60ms)|
Filters
Date Range
Extensions Types Contacts
Categories Tag Schemes
|

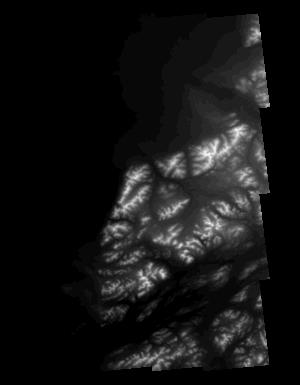
These data are orthorectified radar intensity images (ORI) derived from interferometric synthetic aperture radar (ifsar) data. An ORI is a high-resolution image derived from ifsar which has geometric distortions removed. Unlike optical imagery, ifsar can be collected in cloudy conditions. The USGS performs minimal quality assurance and no reprocessing of the ORI data. USGS distributes the ORI data as received from the contractors, partners or contributing entities.
The 2002 U.S. Geological Survey (USGS) National Seismic Hazard Maps display earthquake ground motions for various probability levels across the United States and are applied in seismic provisions of building codes, insurance rate structures, risk assessments, and other public policy. This update of the maps incorporates new findings on earthquake ground shaking, faults, seismicity, and geodesy. The resulting maps are derived from seismic hazard curves calculated on a grid of sites across the United States that describe the frequency of exceeding a set of ground motions.
Types: Citation;
Tags: B/C site class boundary,
EHP,
Earthquake Hazards Program,
GHSC,
Geologic Hazards Science Center,
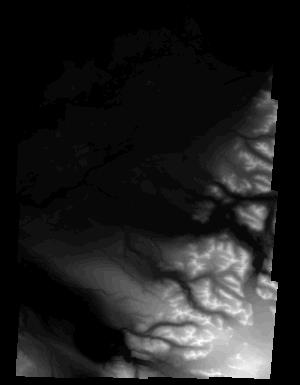
These data are Digital Surface Models (DSM) derived from interferometric synthetic aperture radar (ifsar) data. A DSM is a 3 dimensional representation of surface elevations in an area, including elevations of man-made structures and vegetation. The USGS performs minimal quality assurance and no reprocessing of the DSM data. USGS distributes the DSM data as received from the contractors, partners or contributing entities.
Types: Citation;
Tags: Cartography,
DSM,
Digital Mapping,
Digital Surface Model,
Digital Terrain Model,
This dataset contains images obtained from unmanned aerial systems (UAS) flown in the Cape Cod National Seashore. The objective of the field work was to evaluate the quality and cost of mapping from UAS images. Low-altitude (approximately 120 meters above ground level) digital images were obtained from cameras in a fixed-wing unmanned aerial vehicle (UAV) flown from the lawn adjacent to the Coast Guard Beach parking lot on 1 March, 2016. The UAV was a Skywalker X8 flying wing operated by Raptor Maps, Inc., contractors to the U.S. Geological Survey. U.S. Geological Survey technicians deployed and mapped 28 targets that appear in some of the images for use as ground control points. All activities were conducted according...
Sandy ocean beaches in the United States are popular tourist and recreational destinations and constitute some of the most valuable real estate in the country. The boundary between land and water along the coastline is often the location of concentrated residential and commercial development and is frequently exposed to a range of natural hazards, which include flooding, storm effects, and coastal erosion. In response, the U.S. Geological Survey (USGS) is conducting a national assessment of coastal change hazards. One component of this research effort, the National Assessment of Shoreline Change Project, documents changes in shoreline position as a proxy for coastal change. Shoreline position is an easily understood...
Categories: Data;
Types: Citation,
Downloadable,
Map Service,
OGC WFS Layer,
OGC WMS Layer,
Shapefile;
Tags: Bald Point State Park,
CMGP,
Coastal and Marine Geology Program,
DSAS,
Digital Shoreline Analysis System,
Future climates are simulated by general circulation models (GCM) using climate change scenarios (IPCC 2014). To project climate change for the sagebrush biome, we used 11 GCMs and two climate change scenarios from the IPCC Fifth Assessment, representative concentration pathways (RCPs) 4.5 and 8.5 (Moss et al. 2010, Van Vuuren et al. 2011). RCP4.5 scenario represents a future where climate policies limit and achieve stabilization of greenhouse gas concentrations to 4.5 W m-2 by 2100. RCP8.5 scenario might be called a business-as-usual scenario, where high emissions of greenhouse gases continue in the absence of climate change policies. The two selected time frames allow comparison of near-term (2020-2050) and longer-term...
Categories: Data;
Types: Citation,
Downloadable,
GeoTIFF,
Map Service,
Raster;
Tags: Arizona,
CRS,
California,
Climate,
Colorado,
Wildfire can significantly alter the hydrologic response of a watershed to the extent that even modest rainstorms can produce dangerous flash floods and debris flows. The USGS conducts post-fire debris-flow hazard assessments for select fires in the Western U.S. We use geospatial data related to basin morphometry, burn severity, soil properties, and rainfall characteristics to estimate the probability and volume of debris flows that may occur in response to a design storm.

These data are orthorectified radar intensity images (ORI) derived from interferometric synthetic aperture radar (ifsar) data. An ORI is a high-resolution image derived from ifsar which has geometric distortions removed. Unlike optical imagery, ifsar can be collected in cloudy conditions. The USGS performs minimal quality assurance and no reprocessing of the ORI data. USGS distributes the ORI data as received from the contractors, partners or contributing entities.

These data are orthorectified radar intensity images (ORI) derived from interferometric synthetic aperture radar (ifsar) data. An ORI is a high-resolution image derived from ifsar which has geometric distortions removed. Unlike optical imagery, ifsar can be collected in cloudy conditions. The USGS performs minimal quality assurance and no reprocessing of the ORI data. USGS distributes the ORI data as received from the contractors, partners or contributing entities.
Future climates are simulated by general circulation models (GCM) using climate change scenarios (IPCC 2014). To project climate change for the sagebrush biome, we used 11 GCMs and two climate change scenarios from the IPCC Fifth Assessment, representative concentration pathways (RCPs) 4.5 and 8.5 (Moss et al. 2010, Van Vuuren et al. 2011). RCP4.5 scenario represents a future where climate policies limit and achieve stabilization of greenhouse gas concentrations to 4.5 W m-2 by 2100. RCP8.5 scenario might be called a business-as-usual scenario, where high emissions of greenhouse gases continue in the absence of climate change policies. The two selected time frames allow comparison of near-term (2020-2050) and longer-term...
Categories: Data;
Types: Citation,
Downloadable,
GeoTIFF,
Map Service,
Raster;
Tags: Arizona,
CRS,
California,
Climate,
Colorado,
These data are Digital Surface Models (DSM) derived from interferometric synthetic aperture radar (ifsar) data. A DSM is a 3 dimensional representation of surface elevations in an area, including elevations of man-made structures and vegetation. The USGS performs minimal quality assurance and no reprocessing of the DSM data. USGS distributes the DSM data as received from the contractors, partners or contributing entities.
Types: Citation;
Tags: Cartography,
DSM,
Digital Mapping,
Digital Surface Model,
Digital Terrain Model,

These data are orthorectified radar intensity images (ORI) derived from interferometric synthetic aperture radar (ifsar) data. An ORI is a high-resolution image derived from ifsar which has geometric distortions removed. Unlike optical imagery, ifsar can be collected in cloudy conditions. The USGS performs minimal quality assurance and no reprocessing of the ORI data. USGS distributes the ORI data as received from the contractors, partners or contributing entities.
Future climates are simulated by general circulation models (GCM) using climate change scenarios (IPCC 2014). To project climate change for the sagebrush biome, we used 11 GCMs and two climate change scenarios from the IPCC Fifth Assessment, representative concentration pathways (RCPs) 4.5 and 8.5 (Moss et al. 2010, Van Vuuren et al. 2011). RCP4.5 scenario represents a future where climate policies limit and achieve stabilization of greenhouse gas concentrations to 4.5 W m-2 by 2100. RCP8.5 scenario might be called a business-as-usual scenario, where high emissions of greenhouse gases continue in the absence of climate change policies. The two selected time frames allow comparison of near-term (2020-2050) and longer-term...
Categories: Data;
Types: Citation,
Downloadable,
GeoTIFF,
Map Service,
Raster;
Tags: Arizona,
CRS,
California,
Climate,
Colorado,
|

|
