Filters: Types: Map Service (X) > Tags: {"scheme":"none"} (X) > partyWithName: U.S. Geological Survey (X)
153 results (17ms)|
Filters
Date Range
Extensions
Types
Contacts
Categories Tag Types Tags (with Scheme=none) |
This dataset contains reflectance and transmission spectra of unexpanded and expanded vermiculite ore, and handpicked flakes of phlogopite, hydrobiotite, and vermiculite. These samples were collected from mines near Enoree, South Carolina; Libby, Montana; Louisa, Virginia; Palabora, Llano, Texas; and South Africa. Spectra are identified as either reflectance or transmission in the alphanumeric file names and correlate to specpr record numbers designated in the manuscript figures in which they are shown. These transmission spectra were converted to absorbance in many of the figures. Spectra of talc, fibrous richterite amphibole, and serpentine are from well characterized samples from Feiser Mine, Ruby Mountains,...
A one-year seismic hazard forecast for the Central and Eastern United States, based on induced and natural earthquakes, has been produced by the U.S. Geological Survey. The model assumes that earthquake rates calculated from several different time windows will remain relatively stationary and can be used to forecast earthquake hazard and damage intensity for the year 2016. This assessment is the first step in developing an operational earthquake forecast for the CEUS, and the analysis could be revised with updated seismicity and model parameters. Consensus input models consider alternative earthquake catalog durations, smoothing parameters, maximum magnitudes, and ground motion estimates, and represent uncertainties...
Categories: Data;
Types: Downloadable,
GeoTIFF,
Map Service,
Raster;
Tags: Arizona,
California,
Colorado,
Earthquake,
Hazard,
Water surface elevations within seven Willamette River off-channel features (OCF; alcoves and side channels) were measured using submerged pressure transducers. Transducers were installed from late May through mid-October, 2016, when discharge of the Willamette River was between approximately 5,500 and 45,000 cubic feet per second at Salem, Oregon (USGS gage 14191000) and 3,500 to 17,500 cubic feet per second at Harrisburg, Oregon (USGS gage 14166000). Pressure transducer sensor depth was measured at all seven sites. For five of the sites, pressure transducer sensor depths were converted to water surface elevations by surveying the water surface at each transducer with a real-time kinematic global positioning system...
Categories: Data;
Types: Citation,
Map Service,
OGC WFS Layer,
OGC WMS Layer,
OGC WMS Service;
Tags: Ecology,
Geomorphology,
Oregon,
RTK,
USGS Science Data Catalog (SDC),
Surveys of the bathymetry and backscatter intensity of the sea floor south of Long Island, New York, were carried out in November 1998 using a Simrad EM1000 multibeam echosounder mounted on the Canadian Coast Guard ship Frederick G. Creed. The purpose of the multibeam echosounder surveys was to explore the bathymetry and backscatter intensity of the sea floor in several areas off the southern coast of Long Island along the 20-meter isobath. Survey areas offshore of Fire Island Inlet, Moriches Inlet, Shinnecock Inlet, and southwest of Montauk Point were about 1 kilometer (km) wide and 10 km long. The area was mapped by the U.S. Geological Survey with support from the Canadian Hydrographic Service and the University...
Nitrogen, phosphorus, and suspended-sediment loads, and changes in loads, in major rivers across the Chesapeake Bay watershed have been calculated using monitoring data from the Chesapeake Bay River Input Monitoring Network (RIM) stations for the period 1985 through 2019. Nutrient and suspended-sediment loads and changes in loads were determined by applying a weighted regression approach called WRTDS (Weighted Regression on Time, Discharge, and Season). The load results represent the total mass of nitrogen, phosphorus, and suspended sediment that was exported from each of the RIM watersheds.
Categories: Data;
Types: Map Service,
OGC WFS Layer,
OGC WMS Layer,
OGC WMS Service;
Tags: Chesapeake Bay Watershed,
Delaware,
Maryland,
New York,
Pennsylvania,
This dataset provides shapefile outlines of the 7,150 lakes that had temperature modeled as part of this study. The format is a shapefile for all lakes combined (.shp, .shx, .dbf, and .prj files). A csv file of lake metadata is also included. This dataset is part of a larger data release of lake temperature model inputs and outputs for 7,150 lakes in the U.S. states of Minnesota and Wisconsin (http://dx.doi.org/10.5066/P9CA6XP8).
Categories: Data;
Types: Downloadable,
Map Service,
OGC WFS Layer,
OGC WMS Layer,
Shapefile;
Tags: IA,
IL,
IN,
Illinois,
Indiana,
This dataset consists of 102 magnetotelluric (MT) stations collected in 2012-2014 in the Rio Grande Rift and southern Rocky Mountains. The U.S. Geological Survey acquired these data to improve regional conductivity models of the western United States. This work is in support of studies of the effect of lithospheric modification on electrical resistivity structure and tectonic evolution of the western United States.
Categories: Data;
Types: Citation,
Map Service,
OGC WFS Layer,
OGC WMS Layer,
OGC WMS Service;
Tags: Carson National Forest,
Colfax County,
Colorado,
Colorado Plateau,
Dona Ana County,
The U.S. Geological Survey (USGS) has been engaged in airborne electromagnetics (AEM) since the 1970s, playing a role in the development of early acquisition systems, developing calibration methods, refining standards for data acquisition, improving data processing, modeling, and interpretation methods, and expanding the range of AEM applications. However, USGS AEM survey visibility and data accessibility has not advanced as rapidly as our use of the technique. This data release catalogs AEM surveys in the United States that have contributed to studies under USGS programs including Water, Geologic Mapping, Minerals, Energy, Environmental Health, Ecosystems, Hazards, and Climate. This dataset contains locations for...
Categories: Data;
Types: ArcGIS REST Map Service,
ArcGIS Service Definition,
Downloadable,
Map Service;
Tags: Alabama,
Arizona,
Arkansas,
California,
Colorado,
These data products are preliminary burn severity assessments derived from data obtained from suitable imagery (including Landsat TM, Landsat ETM+, Landsat OLI, Sentinel 2A, and Sentinel 2B). The pre-fire and post-fire subsets included were used to create a differenced Normalized Burn Ratio (dNBR) image. The dNBR image attempts to portray the variation of burn severity within a fire. The severity ratings are influenced by the effects to the canopy. The severity rating is based upon a composite of the severity to the understory (grass, shrub layers), midstory trees and overstory trees. Because there is often a strong correlation between canopy consumption and soil effects, this algorithm works in many cases for Burned...
Coastal wetlands store more carbon than most ecosystems globally. However, little is known about the mechanisms that control the loss of organic matter in coastal wetlands at the landscape scale, and how sea-level rise will impact this important ecological function.
Categories: Data;
Types: Citation,
Map Service,
OGC WFS Layer,
OGC WMS Layer,
OGC WMS Service;
Tags: Barataria Basin,
Louisiana,
Organic matter decomposition,
Terrebonne Basin,
asymptote,
The Assessment Unit is the fundamental unit used in the National Assessment Project for the assessment of undiscovered oil and gas resources. The Assessment Unit is defined within the context of the higher-level Total Petroleum System. The Assessment Unit is shown herein as a geographic boundary interpreted, defined, and mapped by the geologist responsible for the province and incorporates a set of known or postulated oil and (or) gas accumulations sharing similar geologic, geographic, and temporal properties within the Total Petroleum System, such as source rock, timing, migration pathways, trapping mechanism, and hydrocarbon type. The Assessment Unit boundary is defined geologically as the limits of the geologic...
Categories: Data;
Types: Downloadable,
Map Service,
OGC WFS Layer,
OGC WMS Layer,
Shapefile;
Tags: Assessment Unit,
Continuous Assessment Unit,
Earth Science,
Economic geology,
Energy Resources,

This dataset, termed "GAGES II", an acronym for Geospatial Attributes of Gages for Evaluating Streamflow, version II, provides geospatial data and classifications for 9,322 stream gages maintained by the U.S. Geological Survey (USGS). It is an update to the original GAGES, which was published as a Data Paper on the journal Ecology's website (Falcone and others, 2010b) in 2010. The GAGES II dataset consists of gages which have had either 20+ complete years (not necessarily continuous) of discharge record since 1950, or are currently active, as of water year 2009, and whose watersheds lie within the United States, including Alaska, Hawaii, and Puerto Rico. Reference gages were identified based on indicators that they...
Types: Map Service,
OGC WFS Layer,
OGC WMS Layer,
OGC WMS Service;
Tags: Alabama,
Alaska,
All 50 states,
Arizona,
Arkansas,
Ecological flow (EFlow) statistics have been designated to characterize the magnitude, frequency, and duration of extreme high- and low-flows, the timing of seasonal flows, and the consistency of the historic regime. This Child Item contains a table of 178 EFlows for the time periods 1940-1969, 1970-1999, and 2000-2018, with absolute and percent change between periods, where applicable. Statistics were computed by Water Year (WY) for all 178 metrics and absolute and percent change were calculated by comparing metrics between combinations of two of the three time periods (1940-1969 and 1970-1999; 1940-1969 and 2000-2018; 1970-1999 and 2000-2018). Streamgages from the original dataset (n = 409) were excluded from...
Categories: Data;
Types: Map Service,
OGC WFS Layer,
OGC WMS Layer,
OGC WMS Service;
Tags: Chesapeake Bay Watershed,
Delaware,
EFlow,
EFlow statistics,
EGRET,
Nitrogen, phosphorus, and suspended-sediment loads, and changes in loads, in major rivers across the Chesapeake Bay watershed have been calculated using monitoring data from the Chesapeake Bay River Input Monitoring Network (RIM) stations for the period 1985 through 2017. Nutrient and suspended-sediment loads and changes in loads were determined by applying a weighted regression approach called WRTDS (Weighted Regression on Time, Discharge, and Season). The load results represent the total mass of nitrogen, phosphorus, and suspended sediment that was exported from each of the RIM watersheds.
Categories: Data;
Types: Map Service,
OGC WFS Layer,
OGC WMS Layer,
OGC WMS Service;
Tags: Chesapeake Bay Watershed,
Delaware,
Maryland,
New York,
Pennsylvania,
Nitrogen, phosphorus, and suspended-sediment loads, and changes in loads, in major rivers across the Chesapeake Bay watershed have been calculated using monitoring data from the Chesapeake Bay River Input Monitoring Network (RIM) stations for the period 1985 through 2018. Nutrient and suspended-sediment loads and changes in loads were determined by applying a weighted regression approach called WRTDS (Weighted Regression on Time, Discharge, and Season). The load results represent the total mass of nitrogen, phosphorus, and suspended sediment that was exported from each of the RIM watersheds.
Categories: Data;
Types: Map Service,
OGC WFS Layer,
OGC WMS Layer,
OGC WMS Service;
Tags: Chesapeake Bay Watershed,
Delaware,
Maryland,
New York,
Pennsylvania,
Surveys of the bathymetry and backscatter intensity of the sea floor south of Long Island, New York, were carried out in November 1998 using a Simrad EM1000 multibeam echosounder mounted on the Canadian Coast Guard ship Frederick G. Creed. The purpose of the multibeam echosounder surveys was to explore the bathymetry and backscatter intensity of the sea floor in several areas off the southern coast of Long Island along the 20-meter isobath. Survey areas offshore of Fire Island Inlet, Moriches Inlet, Shinnecock Inlet, and southwest of Montauk Point were about 1 kilometer (km) wide and 10 km long. The area was mapped by the U.S. Geological Survey with support from the Canadian Hydrographic Service and the University...
Surveys of the bathymetry and backscatter intensity of the sea floor south of Long Island, New York, were carried out in November 1998 using a Simrad EM1000 multibeam echosounder mounted on the Canadian Coast Guard ship Frederick G. Creed. The purpose of the multibeam echosounder surveys was to explore the bathymetry and backscatter intensity of the sea floor in several areas off the southern coast of Long Island along the 20-meter isobath. Survey areas offshore of Fire Island Inlet, Moriches Inlet, Shinnecock Inlet, and southwest of Montauk Point were about 1 kilometer (km) wide and 10 km long. The area was mapped by the U.S. Geological Survey with support from the Canadian Hydrographic Service and the University...
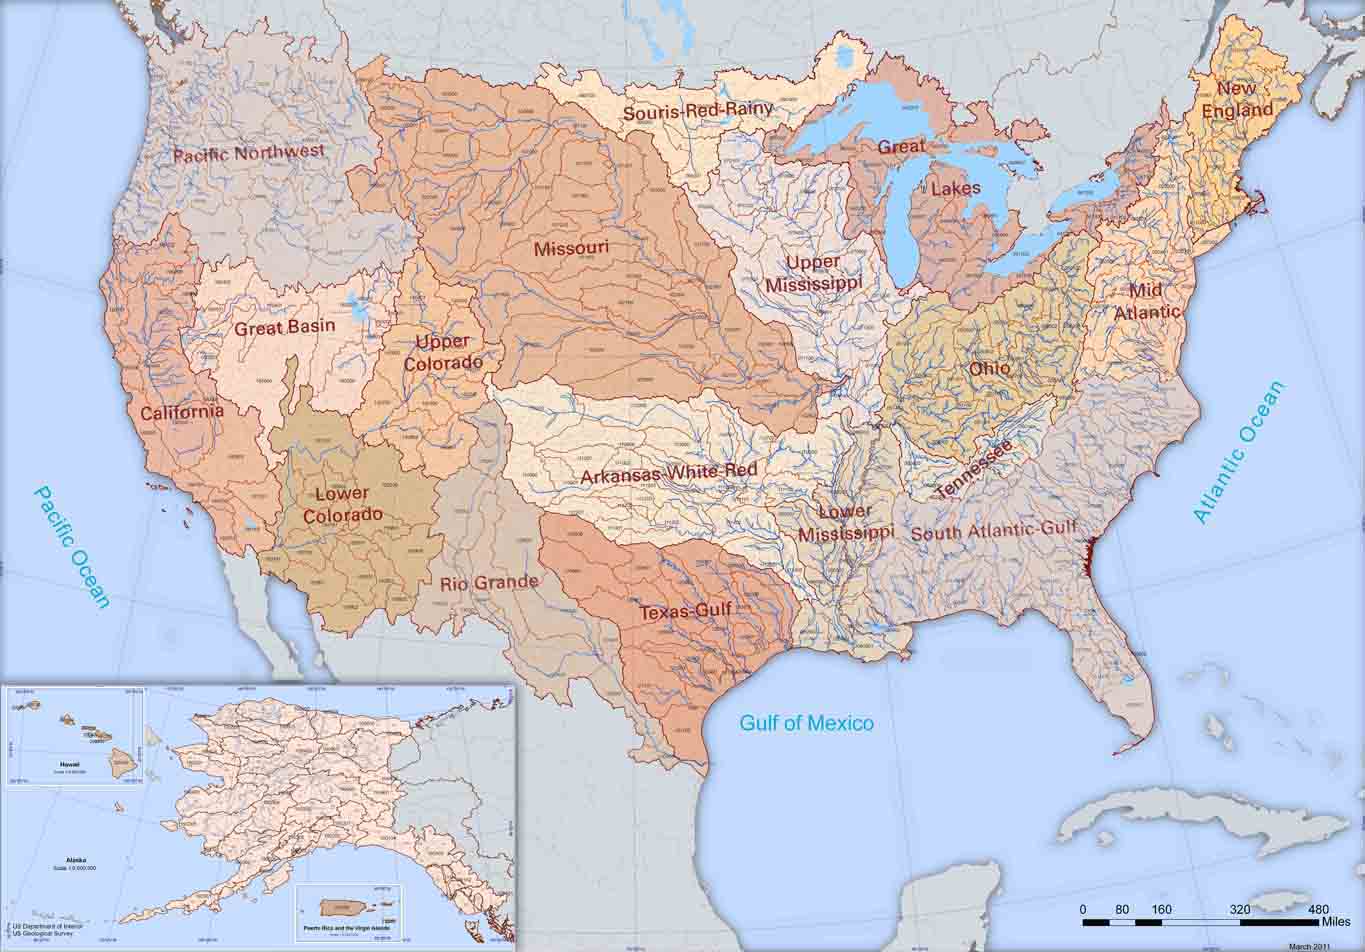
The Watershed Boundary Dataset (WBD) from The National Map (TNM) defines the perimeter of drainage areas formed by the terrain and other landscape characteristics. The drainage areas are nested within each other so that a large drainage area, such as the Upper Mississippi River, will be composed of multiple smaller drainage areas, such as the Wisconsin River. Each of these smaller areas can further be subdivided into smaller and smaller drainage areas. The WBD uses six different levels in this hierarchy, with the smallest averaging about 30,000 acres. The WBD is made up of polygons nested into six levels of data respectively defined by Regions, Subregions, Basins, Subbasins, Watersheds, and Subwatersheds. For additional...
A one-year seismic hazard forecast for the Central and Eastern United States, based on induced and natural earthquakes, has been produced by the U.S. Geological Survey. The model assumes that earthquake rates calculated from several different time windows will remain relatively stationary and can be used to forecast earthquake hazard and damage intensity for the year 2016. This assessment is the first step in developing an operational earthquake forecast for the CEUS, and the analysis could be revised with updated seismicity and model parameters. Consensus input models consider alternative earthquake catalog durations, smoothing parameters, maximum magnitudes, and ground motion estimates, and represent uncertainties...
Categories: Data;
Types: Downloadable,
GeoTIFF,
Map Service,
Raster;
Tags: Arizona,
California,
Colorado,
Earthquake,
Hazard,
This dataset is the result of measurements of groundwater levels in the Equus Beds aquifer near Wichita, Kansas, in January 2016. Potentiometric surfaces are interpolated for the shallow and deep parts of the aquifer, and rasters of the potentiometric surfaces are included in this data release. Wells were classified as being screened in the shallow or deep parts of the aquifer based on station name (some wells have a layer identifier in the station name) or, if no indication of aquifer layer was given in the station name, based on the depth of the well; wells with depths less than 80 feet below land surface were classified as shallow and wells with depths of 80 feet or deeper were classified as deep. Contours with...
Categories: Data;
Types: Citation,
Downloadable,
Map Service,
OGC WFS Layer,
OGC WMS Layer,
Shapefile;
Tags: Arkansas River,
Bentley,
Burrton,
Equus Beds aquifer,
Halstead,
|

|
