Filters: Tags: {"scheme":"Data Basin"} (X) > partyWithName: North Atlantic LCC (X)
22 results (24ms)|
Filters
Date Range
Tags (with Scheme=Data Basin) |

This dataset represents terrestrial and wetland ecological systems of the Northeast (based on NatureServe's Ecological Systems Classifications) combined with human-modified land types such as roads and agriculture. This dataset was created by substantially modifying The Nature Conservancy's Northeast Terrestrial Wildlife Habitat Classification System (NETHCS) using these steps:-Replaced the National Land Cover Database (NLCD) 'roads' embedded in the NETHCS with more accurate roads and train lines that are distinguished from developed classes-Removed spurious development (mostly developed open space) from the edges of NLCD 'roads'-Replaced the single NETHCS open water class with National Wetlands Inventory (NWI)...

This dataset depicts the potential capability of the landscape throughout the Northeastern United States to provide habitat for Wood Thrush (Hylocichla mustelina) based on environmental conditions existing in approximately 2010. Landscape capability integrates factors influencing climate suitability, habitat capability, and other biogeographic factors affecting the speciesâ prevalence in the area. All locations are scored on a scale from 0 to 100, with a value of 0 indicating no capacity to support the species and 100 indicating optimal conditions for the species.This species dataset is one of a larger set of results developed by the Designing Sustainable Landscapes project led by Professor Kevin McGarigal of...
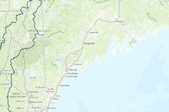
This dataset represents the Connecticut River Watershed Boundary and is from the Watershed Boundary Dataset (WBD). WBD provides a uniquely identified and uniform method of subdividing large drainage areas. The data is intended to be used as a tool for water-resource management and planning activities, particularly for site-specific and localized studies requiring a level of detail provided by large-scale map information. The WBD defines the areal extent of surface water drainage to a point, accounting for all land and surface areas. Watershed Boundaries are determined solely upon science-based hydrologic principles, not favoring any administrative boundaries or special projects, nor particular program or agency....
Tags: Connecticut River Pilot,
boundary

Due to the quantity and complexity of the data, wetlands and riparian data only displays at 1:250,000 scale and greater. For wetland information visit www.fws.gov/wetlands/The original wetland maps were produced as topical overlays using U.S. Geological Survey topographic maps as the base. Thus, the data are intended for use in publications, at a scale of 1:24,000 or smaller. Due to the scale, the primary intended use is for regional and watershed data display and analysis, rather than specific project data analysis. The wetlands data were neither designed nor intended to represent legal or regulatory products. These data were developed in conjunction with the Cowardin et al. publication (Cowardin, L.M., V. Carter,...

The percent tree canopy layer quantifies per pixel tree canopy fraction as a continuous variable from 1 to 100 percent. The file is an 8 Bit continuous data file that will contain values from 0 to 255 when displayed in a software package. The value of '127' is a 'No Data' value applied to areas outside of the modeled percent tree canopy extent. This dataset was derived from the following source:- The Multi-Resolution Land Cover Consortium (MRLC) National Land Cover Dataset (NLCD), last updated in 2001. For more information on the MRLC visit: http://www.mrlc.gov/
Tags: canopy cover,
land cover

This dataset represents the North Atlantic LCC's ecoregion boundary. Landscape conservation cooperatives (LCCs) are conservation-science partnerships between the U.S. Fish and Wildlife Service, U.S. Geological Survey (USGS), and other federal agencies, states, tribes, NGOs, universities and stakeholders within a geographically defined area. They inform resource management decisions to address national-scale stressors-including habitat fragmentation, genetic isolation, spread of invasive species, and water scarcity-all of which are accelerated by climate change.

This is only a test data set to be used as a pilot for the NALCC DataBasin gateway.

To evaluate the potential effects of climate change on wildlife habitat and ecological integrity in the northeastern United States from 2010 to 2080, a University of Massachusetts Amherst team derived a set of climate projections at a fine spatial resolution for the entire Northeast. The projections are based upon publicly available climate models. This dataset represents projections of the total average annual precipitation (mm/year) using one of two IPCC greenhouse gas concentration scenarios (RCP4.5 or RCP8.5). The dataset is intended to represent typical total annual precipitation expected during the years 2010-2080.Detailed documentation for all of the UMass climate datasets is available from: http://jamba.provost.ads.umass.edu/web/lcc/DSL_documentation_climate.pdf...
Tags: Climate,
temperature

The National Land Cover Database products are created through a cooperative project conducted by the Multi-Resolution Land Characteristics (MRLC) Consortium. The MRLC Consortium is a partnership of federal agencies (www.mrlc.gov), consisting of the U.S. Geological Survey (USGS), the National Oceanic and Atmospheric Administration (NOAA), the U.S. Environmental Protection Agency (EPA), the U.S. Department of Agriculture (USDA), the U.S. Forest Service (USFS), the National Park Service (NPS), the U.S. Fish and Wildlife Service (FWS), the Bureau of Land Management (BLM) and the USDA Natural Resources Conservation Service (NRCS). Previously, NLCD consisted of three major data releases based on a 10-year cycle. These...
Tags: land cover. land use,
nlcd

To evaluate the potential effects of climate change on wildlife habitat and ecological integrity in the northeastern United States from 2010 to 2080, a University of Massachusetts Amherst team derived a set of climate projections at a fine spatial resolution for the entire Northeast. The projections are based upon publicly available climate models. This dataset represents projections of the total average annual precipitation (mm/year) using one of two IPCC greenhouse gas concentration scenarios (RCP8.5). The dataset is intended to represent typical total annual precipitation expected during the years 2010-2080. Detailed documentation for all of the UMass climate datasets is available from: http://jamba.provost.ads.umass.edu/web/lcc/DSL_documentation_climate.pdf...
Tags: climate; precipitation

To evaluate the potential effects of climate change on wildlife habitat and ecological integrity in the northeastern United States from 2010 to 2080, a University of Massachusetts Amherst team derived a set of climate projections at a fine spatial resolution for the entire Northeast. The projections are based upon publicly available climate models.This dataset represents the mean of the maximum air temperature (degrees C) for June, July, and August for the year 2010 using one of two IPCC greenhouse gas concentration scenarios (RCP8.5). The dataset is intended to represent typical summer temperatures in the decade centered on 2010 rather than the actual temperatures during 2010. MAP UNITS ARE TEMP. IN DEGREES C MULTIPLIED...
Tags: climate,
temperature

The 30 meter NED is ~1 arc-second data that is updated over large areas by integrating the 10 meter or better source data(where available), re-sampled to 1 arc-second. Where 10 meter or better is not available, 30 meter is used. The U.S. Geological Survey has developed a National Elevation Database (NED).The NED is a seamless mosaic of best-available elevation data. The 7.5-minute elevation data for the conterminous United States are the primary initial source data. In addition to the availability of complete 7.5-minute data, efficient processing methods were developed to filter production artifacts in the existing data, convert to a consistent datum, edge-match, fill slivers of missing data at quadrangle seams,...

To evaluate the potential effects of climate change on wildlife habitat and ecological integrity in the northeastern United States from 2010 to 2080, a University of Massachusetts Amherst team derived a set of climate projections at a fine spatial resolution for the entire Northeast. The projections are based upon publicly available climate models.This dataset represents the mean of the maximum air temperature (degrees C) for June, July, and August for the year 2010 using one of two IPCC greenhouse gas concentration scenarios (RCP4.5). The dataset is intended to represent typical summer temperatures in the decade centered on 2010 rather than the actual temperatures during 2010. MAP UNITS ARE TEMP. IN DEGREES C MULTIPLIED...
Tags: climate,
temperature

The National Land Cover Database products are created through a cooperative project conducted by the Multi-Resolution Land Characteristics (MRLC) Consortium. The MRLC Consortium is a partnership of federal agencies (www.mrlc.gov), consisting of the U.S. Geological Survey (USGS), the National Oceanic and Atmospheric Administration (NOAA), the U.S. Environmental Protection Agency (EPA), the U.S. Department of Agriculture (USDA), the U.S. Forest Service (USFS), the National Park Service (NPS), the U.S. Fish and Wildlife Service (FWS), the Bureau of Land Management (BLM) and the USDA Natural Resources Conservation Service (NRCS). Previously, NLCD consisted of three major data releases based on a 10-year cycle. These...

This dataset depicts imperviousness for the Northeastern United States. Imperviousness is the percentage of the ground surface area that is impervious to water infiltration. Development such as roads and buildings increase imperviousness, which can have large effects on both aquatic and terrestrial ecosystems.The dataset is derived from two sources: 1) the 2006 National Land Cover Database (NLCD 2006), percent impervious product, and 2) OpenStreetMap (www.openstreetmap.org). The NLCD 2006 was developed by the Multi-Resolution Land Cover Consortium (MRLC), which makes available metadata for the NLCD 2006 , NLCD 2001, and other information that describes how the imperviousness product was developed (www.mrlc.gov)....

Web Mapping Service for Conservation Design, a website run by the Appalachian Landscape Conservation Cooperative

This dataset depicts the potential capability of the landscape throughout the Northeastern United States to provide habitat for Blackpoll Warbler (Setophaga striata) based on environmental conditions existing in approximately 2010. Landscape capability integrates factors influencing climate suitability, habitat capability, and other biogeographic factors affecting the speciesâ prevalence in the area. All locations are scored on a scale from 0 to 100, with a value of 0 indicating no capacity to support the species and 100 indicating optimal conditions for the species.This species dataset is one of a larger set of results developed by the Designing Sustainable Landscapes project led by Professor Kevin McGarigal...

To evaluate the potential effects of climate change on wildlife habitat and ecological integrity in the northeastern United States from 2010 to 2080, a University of Massachusetts Amherst team derived a set of climate projections at a fine spatial resolution for the entire Northeast. The projections are based upon publicly available climate models.This dataset represents the growing season degree days (number of days in which the average temperature is > 10 degrees C) using one of two IPCC greenhouse gas concentration scenarios (RCP8.5). The dataset is intended to represent typical growing season degree days for the years 2010-2080 rather than the actual growing season degree days. MAP UNITS ARE THE SUM OF DEGREES...

To evaluate the potential effects of climate change on wildlife habitat and ecological integrity in the northeastern United States from 2010 to 2080, a University of Massachusetts Amherst team derived a set of climate projections at a fine spatial resolution for the entire Northeast. The projections are based upon publicly available climate models.This dataset represents the mean of the minimum air temperature (degrees C) for December, January, and February for the year 2010 using one of two IPCC greenhouse gas concentration scenarios (RCP8.5). The dataset is intended to represent typical winter temperatures in the decade centered on 2010 rather than the actual temperatures during 2010. MAP UNITS ARE TEMP. IN DEGREES...
Tags: climate,
temperature

This is only a test data set to be used as a pilot for the NALCC DataBasin gateway.
|

|
