Filters: Tags: Arizona (X) > Date Range: {"choice":"year"} (X)
1,277 results (766ms)|
Filters
Date Types (for Date Range)
Types
Contacts
Categories Tag Types
|
Layers of geospatial data include contours, boundaries, land cover, hydrography, roads, transportation, geographic names, structures, and other selected map features.
Layers of geospatial data include contours, boundaries, land cover, hydrography, roads, transportation, geographic names, structures, and other selected map features.
Layers of geospatial data include contours, boundaries, land cover, hydrography, roads, transportation, geographic names, structures, and other selected map features.
Layers of geospatial data include contours, boundaries, land cover, hydrography, roads, transportation, geographic names, structures, and other selected map features.
Layers of geospatial data include contours, boundaries, land cover, hydrography, roads, transportation, geographic names, structures, and other selected map features.
Layers of geospatial data include contours, boundaries, land cover, hydrography, roads, transportation, geographic names, structures, and other selected map features.
Layers of geospatial data include contours, boundaries, land cover, hydrography, roads, transportation, geographic names, structures, and other selected map features.
Layers of geospatial data include contours, boundaries, land cover, hydrography, roads, transportation, geographic names, structures, and other selected map features.
Layers of geospatial data include contours, boundaries, land cover, hydrography, roads, transportation, geographic names, structures, and other selected map features.
Layers of geospatial data include contours, boundaries, land cover, hydrography, roads, transportation, geographic names, structures, and other selected map features.
Layers of geospatial data include contours, boundaries, land cover, hydrography, roads, transportation, geographic names, structures, and other selected map features.
Layers of geospatial data include contours, boundaries, land cover, hydrography, roads, transportation, geographic names, structures, and other selected map features.
These data were compiled to provide a resource for other researchers interested in water-surface elevations and flow velocity across a wide range of discharge in the study reach for the project. Objective(s) of our study were to construct a two-dimensional hydrodynamic model for the 15.8 mile tailwater reach of the Colorado River in Glen Canyon between Glen Canyon Dam and Lees Ferry, Arizona. These data represent the results of the two-dimensional modeling effort with each data table (50) including the results of each run of the model. Additionally, other data represent a comparison of modeled water surface elevations to measured water surface elevations for historic Bureau of Reclamation cross sections in the study...
South of Interstate 40 elk reside primarily in Arizona’s Game Management Unit (GMU) 8. Upon completing population surveys in 2021, approximately 4,000 elk were estimated to inhabit GMU 8. Their summer range is primarily characterized by high-elevation ponderosa pine forests and grasslands. The elk radiate out from various origin points within their summer range to their winter range, comprised of rims of canyons in the area, including Sycamore Canyon, Tule Canyon, and Government Canyon. This series of canyons creates an impermeable southern boundary for this herd. Their winter range along the rim country is primarily characterized by pinyon-juniper, manzanita, and scrub oak. Interstate 40 is the primary threat to...
Categories: Data;
Types: Downloadable,
Map Service,
OGC WFS Layer,
OGC WMS Layer,
Shapefile;
Tags: Arizona,
Flagstaff,
United States,
animal behavior,
biota,
These data represent total vegetation and surface water along approximately 12 kilometers of the Paria River upstream from the confluence of the Colorado River at Lees Ferry, Arizona. They are derived from airborne, multispectral imagery obtained in late May 2009, 2013, and 2021, collected with a push-broom sensor with 4 spectral bands depicting Blue, Green, Red and Near-Infrared wavelengths at a spatial resolution of 20 centimeters. The vegetation classification data were created using a supervised classification algorithm provided by Harris Geospatial in ENVI version 5.6.3 (Exelis Visual Information Solutions, Boulder, Colorado). The water data were created using a Green Normalized Difference Vegetation Index...
These data were compiled to create models that estimate entrainment rates and population growth rates of smallmouth bass below Glen Canyon Dam. Objective(s) of our study were to predict smallmouth bass entrainment rates and population growth under different future scenarios of Lake Powell elevations and management. These data represent parameters needed for associated models and data needed to produce figures. These data were collected from publicly available online sources including published papers and federal government datasets. These data were assembled by researchers from U.S. Geological Survey, Utah State University, Colorado State University, U.S. Fish and Wildlife Service. These data can be used to run...
Geospatial data is comprised of government boundaries.
Across the country, public land managers make hundreds of decisions each year that influence landscapes and ecosystems within the lands they manage. Many of these decisions involve vegetation manipulations known as land treatments. Land treatments include activities such as removal or alteration of plant biomass, seeding burned areas, and herbicide applications. Data on these land treatments historically have been stored at local offices and gathering information across large spatial areas was difficult. These valuable data needed to be centralized and stored for Federal agencies involved in land treatments because these data are useful to land managers for policy and management and to scientists for developing...
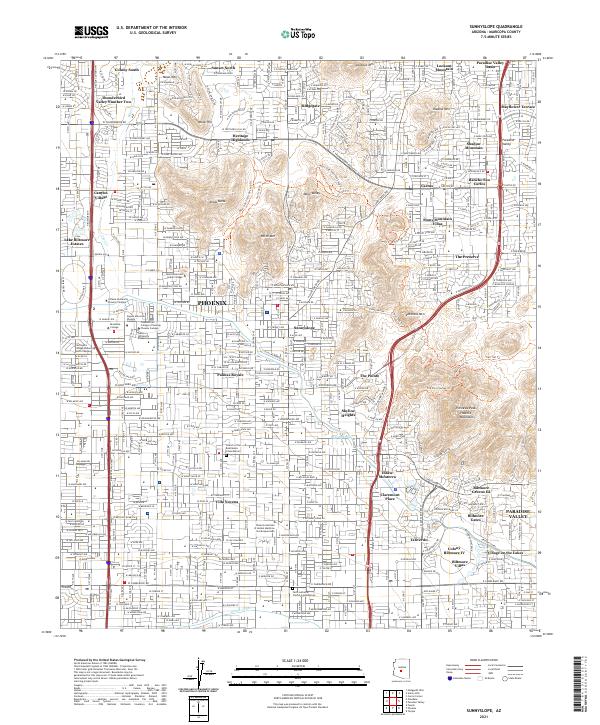
Layered geospatial PDF 7.5 Minute Quadrangle Map. Layers of geospatial data include orthoimagery, roads, grids, geographic names, elevation contours, hydrography, and other selected map features. This map is derived from GIS (geospatial information system) data. It represents a repackaging of GIS data in traditional map form, not creation of new information. The geospatial data in this map are from selected National Map data holdings and other government sources.
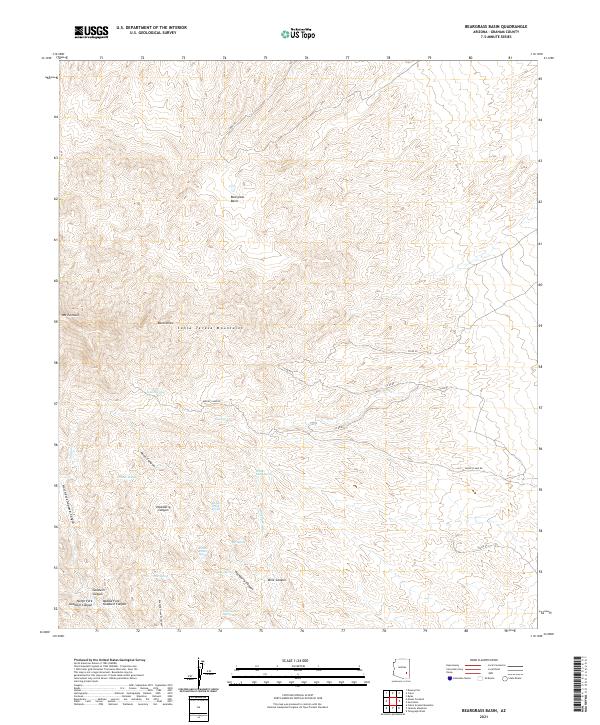
Layered geospatial PDF 7.5 Minute Quadrangle Map. Layers of geospatial data include orthoimagery, roads, grids, geographic names, elevation contours, hydrography, and other selected map features. This map is derived from GIS (geospatial information system) data. It represents a repackaging of GIS data in traditional map form, not creation of new information. The geospatial data in this map are from selected National Map data holdings and other government sources.
|

|
