Filters: Tags: Barnstable County (X)
82 results (11ms)|
Filters
Date Range
Extensions Types
Contacts
Categories Tag Types Tag Schemes |
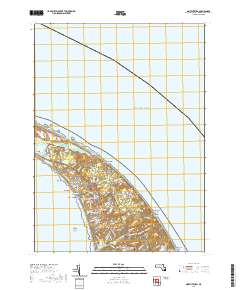
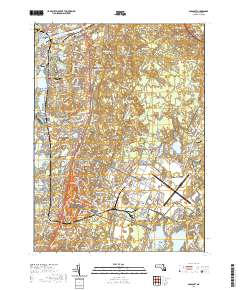
Layered geospatial PDF 7.5 Minute Quadrangle Map. Layers of geospatial data include orthoimagery, roads, grids, geographic names, elevation contours, hydrography, and other selected map features. This map is derived from GIS (geospatial information system) data. It represents a repackaging of GIS data in traditional map form, not creation of new information. The geospatial data in this map are from selected National Map data holdings and other government sources.

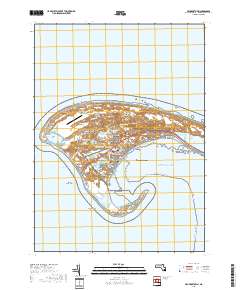
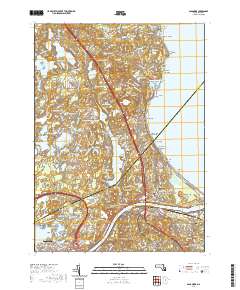
Layered geospatial PDF 7.5 Minute Quadrangle Map. Layers of geospatial data include orthoimagery, roads, grids, geographic names, elevation contours, hydrography, and other selected map features. This map is derived from GIS (geospatial information system) data. It represents a repackaging of GIS data in traditional map form, not creation of new information. The geospatial data in this map are from selected National Map data holdings and other government sources.
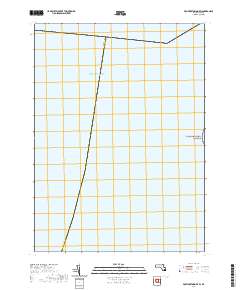
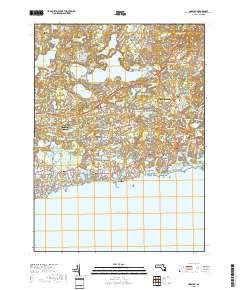
Layered geospatial PDF 7.5 Minute Quadrangle Map. Layers of geospatial data include orthoimagery, roads, grids, geographic names, elevation contours, hydrography, and other selected map features. This map is derived from GIS (geospatial information system) data. It represents a repackaging of GIS data in traditional map form, not creation of new information. The geospatial data in this map are from selected National Map data holdings and other government sources.
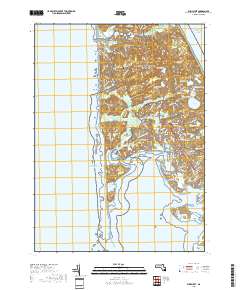
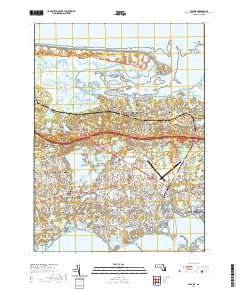
Layered geospatial PDF 7.5 Minute Quadrangle Map. Layers of geospatial data include orthoimagery, roads, grids, geographic names, elevation contours, hydrography, and other selected map features. This map is derived from GIS (geospatial information system) data. It represents a repackaging of GIS data in traditional map form, not creation of new information. The geospatial data in this map are from selected National Map data holdings and other government sources.
Layered geospatial PDF 7.5 Minute Quadrangle Map. Layers of geospatial data include orthoimagery, roads, grids, geographic names, elevation contours, hydrography, and other selected map features. This map is derived from GIS (geospatial information system) data. It represents a repackaging of GIS data in traditional map form, not creation of new information. The geospatial data in this map are from selected National Map data holdings and other government sources.
Water resources around the world are contaminated with per- and polyfluoroalkyl substances (PFAS) due to releases from point sources on military installations, fire training centers, and chemical manufacturing sites. Non-point sources have also been identified including wastewater effluent, landfills, and biosolids application. PFAS are a major concern to myriad stakeholders as some are known to bioaccumulate, they have eco-toxicity effects, and they are highly recalcitrant. PFAS are often called “forever chemicals” due to their environmental persistence but many precursor PFAS are transformed in the environment by microbes. Recent work has shown that PFAS can be biologically degraded in laboratory studies, but...
Categories: Data;
Tags: Barnstable County,
Cape Cod,
DNA sequencing,
Environmental Health,
Hydrology,
Extended time-series sensor data were collected between 2012 and 2016 in surface water of a tidal salt-marsh creek on Cape Cod, Massachusetts. The objective of this field study was to measure water chemical characteristics and flows, as part of a study to quantify lateral fluxes of dissolved carbon species between the salt marsh and estuary. Data consist of in-situ measurements including: salinity, temperature, pH, dissolved oxygen, redox potential, fluorescent dissolved organic matter, turbidity and chlorophyll. Surface water flow, water level and water elevation data were also measured. The data provided in this release represent a compiled data set consisting of multiple sensor deployments between 2012 and 2016.
Categories: Data,
Data Release - Revised;
Tags: Barnstable County,
Cape Cod,
Commonwealth of Massachusetts,
Falmouth,
Geochemistry,
Integrated terrain models covering 16,357 square kilometers of the Massachusetts coastal zone and offshore waters were built to provide a continuous elevation and bathymetry terrain model for ocean planning purposes. The area is divided into the following four geographical areas to reduce file size and facilitate publishing: Massachusetts Bay from the Massachusetts-New Hampshire border south to Provincetown and Scituate and east to Stellwagen Bank; Cape Cod Bay from Provincetown to Scituate and south to Hyannis; Buzzards Bay from the Cape Cod Canal southwest to the State border including the Elizabeth Islands and extending north to Fall River and Mount Hope Bay; and Nantucket and Vineyard Sounds, from Hyannis south...
Types: Map Service,
OGC WFS Layer,
OGC WMS Layer,
OGC WMS Service;
Tags: Barnstable County,
Bristol County,
Buzzards Bay,
CZM,
Cape Cod Canal,
Layered geospatial PDF 7.5 Minute Quadrangle Map. Layers of geospatial data include orthoimagery, roads, grids, geographic names, elevation contours, hydrography, and other selected map features. This map is derived from GIS (geospatial information system) data. It represents a repackaging of GIS data in traditional map form, not creation of new information. The geospatial data in this map are from selected National Map data holdings and other government sources.
Layered geospatial PDF 7.5 Minute Quadrangle Map. Layers of geospatial data include orthoimagery, roads, grids, geographic names, elevation contours, hydrography, and other selected map features. This map is derived from GIS (geospatial information system) data. It represents a repackaging of GIS data in traditional map form, not creation of new information. The geospatial data in this map are from selected National Map data holdings and other government sources.
Unvegetated to vegetated marsh ratio in Cape Cod National Seashore salt marsh complex, Massachusetts
Note: The 2021 data release "Geospatial characterization of salt marshes for Massachusetts" is a more recent and comprehensive MA salt marsh dataset. (https://doi.org/10.5066/P97E086F) Unvegetated to vegetated marsh ratio (UVVR) in the Cape Cod National Seashore (CACO) salt marsh complex and approximal wetlands is computed based on conceptual marsh units defined by Defne and Ganju (2019). UVVR was calculated based on U.S. Department of Agriculture National Agriculture Imagery Program (NAIP) 1-meter resolution imagery. Through scientific efforts initiated with the Hurricane Sandy Science Plan, the U.S. Geological Survey has been expanding national assessment of coastal change hazards and forecast products to coastal...
Categories: Data;
Types: Downloadable,
Map Service,
OGC WFS Layer,
OGC WMS Layer,
Shapefile;
Tags: Atlantic Ocean,
Barnstable County,
Cape Cod Bay,
Cape Cod National Seashore,
Ecology,
Note: The 2021 data release "Geospatial characterization of salt marshes for Massachusetts" is a more recent and comprehensive MA salt marsh dataset. (https://doi.org/10.5066/P97E086F) The salt marsh complex of Cape Cod National Seashore (CACO), Massachusetts, USA and approximal wetlands were delineated to smaller, conceptual marsh units by geoprocessing of surface elevation data. Flow accumulation based on the relative elevation of each location is used to determine the ridge lines that separate each marsh unit while the surface slope is used to automatically assign each unit a drainage point, where water is expected to drain through. Through scientific efforts initiated with the Hurricane Sandy Science Plan,...
Categories: Data;
Types: Downloadable,
Map Service,
OGC WFS Layer,
OGC WMS Layer,
Shapefile;
Tags: Atlantic Ocean,
Barnstable County,
Cape Cod Bay,
Cape Cod National Seashore,
Ecology,
This U.S. Geological Survey data release provides a comprehensive dataset of water-quality data and sampling-site characteristics collected in 1978–2018 during a study of the effects of land disposal of treated wastewater on groundwater quality in an unconsolidated sand and gravel aquifer on Cape Cod, Massachusetts. Treated sewage-derived wastewater was discharged to rapid-infiltration beds at Joint Base Cape Cod for nearly 60 years before the disposal was moved to a different location in December 1995. The discharge formed a plume of contaminated groundwater that partly discharges to a glacial kettle lake about 1,600 feet from the beds and extends about 4.5 miles toward coastal saltwater bodies at Vineyard Sound....
Categories: Data;
Types: Map Service,
OGC WFS Layer,
OGC WMS Layer,
OGC WMS Service;
Tags: Barnstable County,
Bourne,
Cape Cod,
Falmouth,
Mashpee,
Layered geospatial PDF 7.5 Minute Quadrangle Map. Layers of geospatial data include orthoimagery, roads, grids, geographic names, elevation contours, hydrography, and other selected map features. This map is derived from GIS (geospatial information system) data. It represents a repackaging of GIS data in traditional map form, not creation of new information. The geospatial data in this map are from selected National Map data holdings and other government sources.
Layered geospatial PDF 7.5 Minute Quadrangle Map. Layers of geospatial data include orthoimagery, roads, grids, geographic names, elevation contours, hydrography, and other selected map features. This map is derived from GIS (geospatial information system) data. It represents a repackaging of GIS data in traditional map form, not creation of new information. The geospatial data in this map are from selected National Map data holdings and other government sources.
Layered geospatial PDF 7.5 Minute Quadrangle Map. Layers of geospatial data include orthoimagery, roads, grids, geographic names, elevation contours, hydrography, and other selected map features. This map is derived from GIS (geospatial information system) data. It represents a repackaging of GIS data in traditional map form, not creation of new information. The geospatial data in this map are from selected National Map data holdings and other government sources.
Layered geospatial PDF 7.5 Minute Quadrangle Map. Layers of geospatial data include orthoimagery, roads, grids, geographic names, elevation contours, hydrography, and other selected map features. This map is derived from GIS (geospatial information system) data. It represents a repackaging of GIS data in traditional map form, not creation of new information. The geospatial data in this map are from selected National Map data holdings and other government sources.
Layered geospatial PDF 7.5 Minute Quadrangle Map. Layers of geospatial data include orthoimagery, roads, grids, geographic names, elevation contours, hydrography, and other selected map features. This map is derived from GIS (geospatial information system) data. It represents a repackaging of GIS data in traditional map form, not creation of new information. The geospatial data in this map are from selected National Map data holdings and other government sources.
Note: The 2021 data release "Geospatial characterization of salt marshes for Massachusetts" is a more recent and comprehensive MA salt marsh dataset. (https://doi.org/10.5066/P97E086F) Elevation distribution in the Cape Cod National Seashore (CACO) salt marsh complex and approximal wetlands is given in terms of mean elevation of conceptual marsh units defined by Defne and Ganju (2019). The elevation data is based on the 1-meter resolution Coastal National Elevation Database (CoNED), where data gaps exist. Through scientific efforts initiated with the Hurricane Sandy Science Plan, the U.S. Geological Survey has been expanding national assessment of coastal change hazards and forecast products to coastal wetlands....
Categories: Data;
Types: Downloadable,
Map Service,
OGC WFS Layer,
OGC WMS Layer,
Shapefile;
Tags: Atlantic Ocean,
Barnstable County,
Cape Cod Bay,
Cape Cod National Seashore,
Ecology,
Layered geospatial PDF 7.5 Minute Quadrangle Map. Layers of geospatial data include orthoimagery, roads, grids, geographic names, elevation contours, hydrography, and other selected map features. This map is derived from GIS (geospatial information system) data. It represents a repackaging of GIS data in traditional map form, not creation of new information. The geospatial data in this map are from selected National Map data holdings and other government sources.
|

|
