Filters: Tags: Boston (X)
65 results (34ms)|
Filters
Date Range
Extensions Types
Contacts
Categories Tag Types Tag Schemes |
The Massachusetts Office of Coastal Zone Management launched the Shoreline Change Project in 1989 to identify erosion-prone areas of the coast and support local land-use decisions. Trends of shoreline position over long and short-term timescales provide information to landowners, managers, and potential buyers about possible future impacts to coastal resources and infrastructure. In 2001, a 1994 shoreline was added to calculate both long- and short-term shoreline change rates along ocean-facing sections of the Massachusetts coast. In 2013 two oceanfront shorelines for Massachusetts were added using 2008-2009 color aerial orthoimagery and 2007 topographic lidar datasets obtained from NOAA's Ocean Service, Coastal...
Categories: Data;
Types: Downloadable,
Map Service,
OGC WFS Layer,
OGC WMS Layer,
OGC WMS Service,
Shapefile;
Tags: Accretion,
Atlantic Coast,
Baseline,
Boston,
CMGP,
The Massachusetts Office of Coastal Zone Management launched the Shoreline Change Project in 1989 to identify erosion-prone areas of the coast and support local land-use decisions. Trends of shoreline position over long and short-term timescales provide information to landowners, managers, and potential buyers about possible future impacts to coastal resources and infrastructure. In 2001, a 1994 shoreline was added to calculate both long- and short-term shoreline change rates along ocean-facing sections of the Massachusetts coast. In 2013 two oceanfront shorelines for Massachusetts were added using 2008-2009 color aerial orthoimagery and 2007 topographic lidar datasets obtained from NOAA's Ocean Service, Coastal...
Categories: Data;
Types: Downloadable,
Map Service,
OGC WFS Layer,
OGC WMS Layer,
Shapefile;
Tags: Accretion,
Atlantic Coast,
Baseline,
Boston,
CMGP,
USGS Historical Quadrangle in GeoPDF.
USGS Historical Quadrangle in GeoPDF.
USGS Historical Quadrangle in GeoPDF.
USGS Historical Quadrangle in GeoPDF.
USGS Historical Quadrangle in GeoPDF.
USGS Historical Quadrangle in GeoPDF.
This data set contains imagery from the National Agriculture Imagery Program (NAIP). The NAIP program is administered by USDA FSA and has been established to support two main FSA strategic goals centered on agricultural production. These are, increase stewardship of America's natural resources while enhancing the environment, and to ensure commodities are procured and distributed effectively and efficiently to increase food security. The NAIP program supports these goals by acquiring and providing ortho imagery that has been collected during the agricultural growing season in the U.S. The NAIP ortho imagery is tailored to meet FSA requirements and is a fundamental tool used to support FSA farm and conservation programs....
USGS Historical Quadrangle in GeoPDF.
The Massachusetts Office of Coastal Zone Management launched the Shoreline Change Project in 1989 to identify erosion-prone areas of the coast. The shoreline position and change rate are used to inform management decisions regarding the erosion of coastal resources. In 2001, a shoreline from 1994 was added to calculate both long- and short-term shoreline change rates along ocean-facing sections of the Massachusetts coast. In 2013, two oceanfront shorelines for Massachusetts were added using 2008-9 color aerial orthoimagery and 2007 topographic lidar datasets obtained from the National Oceanic and Atmospheric Administration's Ocean Service, Coastal Services Center. This 2018 data release includes rates that incorporate...
Categories: Data;
Types: Downloadable,
Map Service,
OGC WFS Layer,
OGC WMS Layer,
Shapefile;
Tags: Accretion,
Atlantic Coast,
Baseline,
Boston,
CMGP,
The Massachusetts Office of Coastal Zone Management launched the Shoreline Change Project in 1989 to identify erosion-prone areas of the coast and support local land-use decisions. Trends of shoreline position over long and short-term timescales provide information to landowners, managers, and potential buyers about possible future impacts to coastal resources and infrastructure. In 2001, a 1994 shoreline was added to calculate both long- and short-term shoreline change rates along ocean-facing sections of the Massachusetts coast. In 2013 two oceanfront shorelines for Massachusetts were added using 2008-2009 color aerial orthoimagery and 2007 topographic lidar datasets obtained from NOAA's Ocean Service, Coastal...
Categories: Data;
Types: Downloadable,
Map Service,
OGC WFS Layer,
OGC WMS Layer,
Shapefile;
Tags: Atlantic Coast,
Boston,
CMGP,
Coastal and Marine Geology Program,
DSAS,
The Massachusetts Office of Coastal Zone Management launched the Shoreline Change Project in 1989 to identify erosion-prone areas of the coast and support local land-use decisions. Trends of shoreline position over long and short-term timescales provide information to landowners, managers, and potential buyers about possible future impacts to coastal resources and infrastructure. In 2001, a 1994 shoreline was added to calculate both long- and short-term shoreline change rates along ocean-facing sections of the Massachusetts coast. In 2013 two oceanfront shorelines for Massachusetts were added using 2008-2009 color aerial orthoimagery and 2007 topographic lidar datasets obtained from NOAA's Ocean Service, Coastal...
Categories: Data;
Types: Downloadable,
Map Service,
OGC WFS Layer,
OGC WMS Layer,
Shapefile;
Tags: Accretion,
Atlantic Coast,
Baseline,
Boston,
CMGP,
The U.S. Geological Survey’s StreamStats program is a publicly-accessible web application (https://streamstats.usgs.gov) that can be used to delineate drainage areas, compute basin characteristics, and estimate flow statistics for user-selected locations on streams. StreamStats services are typically implemented at the statewide or watershed scale (referred to as state or basin applications), and although the three core functionalities remain consistent, many states have implemented custom tools to address specific water-resources planning and management needs. In Massachusetts, a watershed-scale application for the Mystic River Basin was developed to support stakeholder efforts to address stormwater challenges...
USGS Historical Quadrangle in GeoPDF.
USGS Historical Quadrangle in GeoPDF.
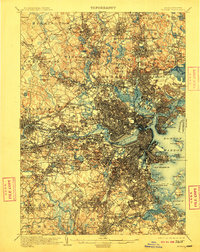
USGS Historical Quadrangle in GeoPDF.
USGS Historical Quadrangle in GeoPDF.
USGS Historical Quadrangle in GeoPDF.
USGS Historical Quadrangle in GeoPDF.
|

|
