Filters: Tags: Boulder County (X)
210 results (65ms)|
Filters
Date Range
Extensions Types Contacts
Categories Tag Types
|
Probability of suitable habitat for Black Tailed Prairie Dogs for each cell of raster. Probability is measured from 0 to 1 with 0 being low habitat suitability and 1 being high suitability. Probability data is created from fitting a global second-order model to county level raster data. For details on model fitting and data used to produce probability raster see report. https://www.fws.gov/science/catalog
Categories: Data;
Types: Downloadable,
GeoTIFF,
Map Service,
Raster;
Tags: Black Tailed Prairie Dogs,
Boulder County,
Colorado,
Great Plains,
Habitat suitability,
LEFT HAND CREEK NR NIWOT
N. Saint Vrain High JAMS Project Rocky Mountain National Park near Thunder Lake
S BOULDER CR AT BASELINE ROAD NR BOULDER COLO
S BOULDER CR AT BASELINE ROAD NR BOULDER COLO
ROCK CREEK ABV ROCK CREEK PKWY, AT SUPERIOR, CO
BOULDER CREEK BLW 61ST STREET, NR BOULDER, CO
The Captain Jack Superfund site near Ward, Colorado hosts extensive interconnected underground mine workings, which drain via the Big Five Adit. Drainage from the adit has historically been acidic with elevated concentrations of metals. In 2018 the U.S. Environmental Protection Agency (EPA) utilized a subsurface remediation strategy consisting of the installation of a hydraulic bulkhead within the workings to preclude drainage out of the mine. To understand the processes occurring during water impoundment within the mine workings, the U.S. Geological Survey (USGS), in cooperation with EPA, completed water-quality sampling and analysis during 2020 as water was impounded within the mine workings. The USGS sampling...
Categories: Data;
Types: Downloadable,
Map Service,
OGC WFS Layer,
OGC WMS Layer,
Shapefile;
Tags: Boulder County,
Colorado,
Geochemistry,
Hydrology,
USGS Science Data Catalog (SDC),
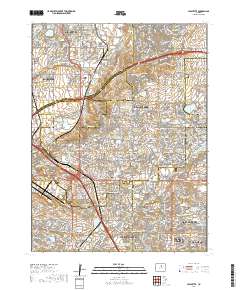
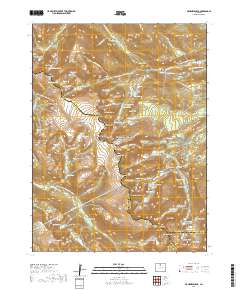
Layered geospatial PDF 7.5 Minute Quadrangle Map. Layers of geospatial data include orthoimagery, roads, grids, geographic names, elevation contours, hydrography, and other selected map features. This map is derived from GIS (geospatial information system) data. It represents a repackaging of GIS data in traditional map form, not creation of new information. The geospatial data in this map are from selected National Map data holdings and other government sources.
Layered geospatial PDF 7.5 Minute Quadrangle Map. Layers of geospatial data include orthoimagery, roads, grids, geographic names, elevation contours, hydrography, and other selected map features. This map is derived from GIS (geospatial information system) data. It represents a repackaging of GIS data in traditional map form, not creation of new information. The geospatial data in this map are from selected National Map data holdings and other government sources.
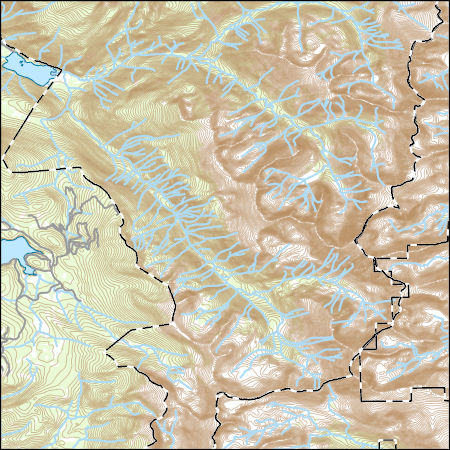
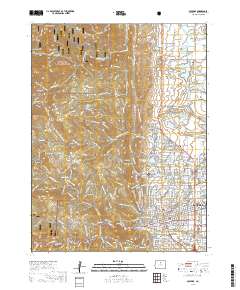
Layers of geospatial data include contours, boundaries, land cover, hydrography, roads, transportation, geographic names, structures, and other selected map features.
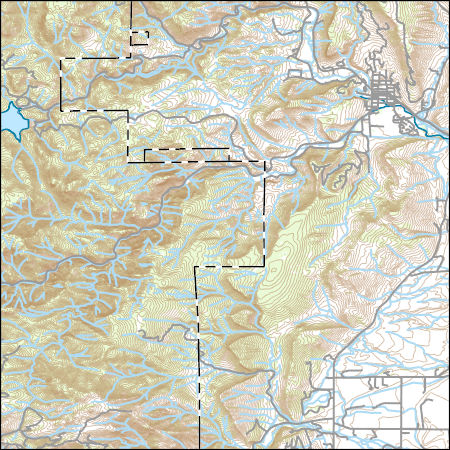
Layers of geospatial data include contours, boundaries, land cover, hydrography, roads, transportation, geographic names, structures, and other selected map features.
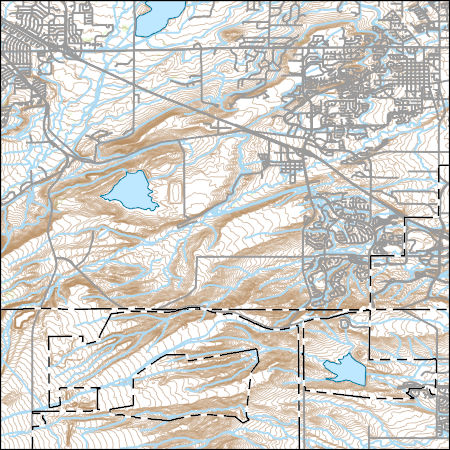
Layers of geospatial data include contours, boundaries, land cover, hydrography, roads, transportation, geographic names, structures, and other selected map features.
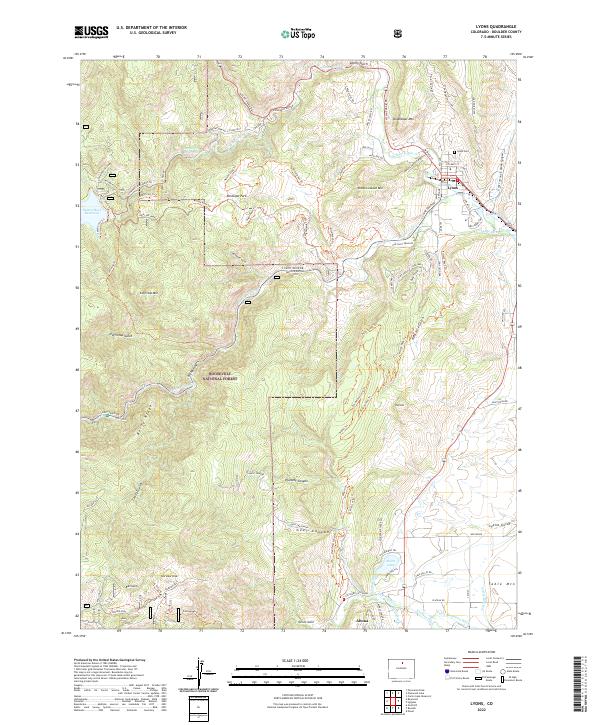
Layered geospatial PDF 7.5 Minute Quadrangle Map. Layers of geospatial data include orthoimagery, roads, grids, geographic names, elevation contours, hydrography, and other selected map features. This map is derived from GIS (geospatial information system) data. It represents a repackaging of GIS data in traditional map form, not creation of new information. The geospatial data in this map are from selected National Map data holdings and other government sources.
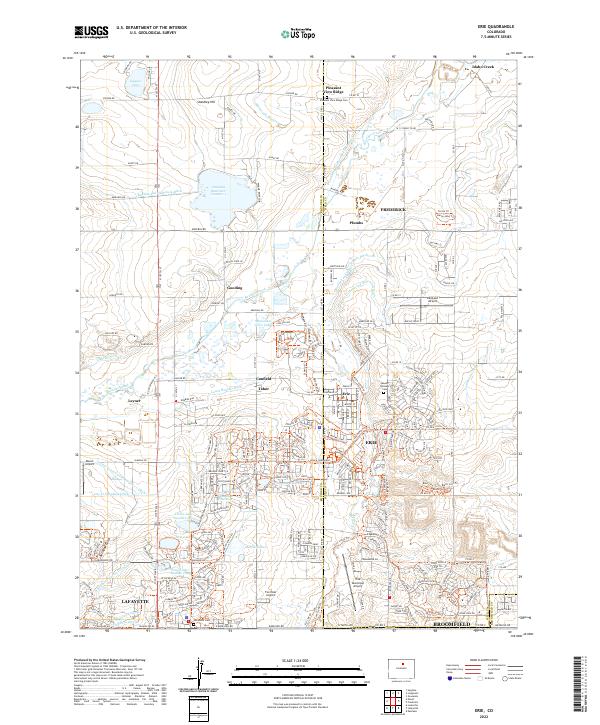
Layered geospatial PDF 7.5 Minute Quadrangle Map. Layers of geospatial data include orthoimagery, roads, grids, geographic names, elevation contours, hydrography, and other selected map features. This map is derived from GIS (geospatial information system) data. It represents a repackaging of GIS data in traditional map form, not creation of new information. The geospatial data in this map are from selected National Map data holdings and other government sources.
Layered geospatial PDF 7.5 Minute Quadrangle Map. Layers of geospatial data include orthoimagery, roads, grids, geographic names, elevation contours, hydrography, and other selected map features. This map is derived from GIS (geospatial information system) data. It represents a repackaging of GIS data in traditional map form, not creation of new information. The geospatial data in this map are from selected National Map data holdings and other government sources.
Layered geospatial PDF 7.5 Minute Quadrangle Map. Layers of geospatial data include orthoimagery, roads, grids, geographic names, elevation contours, hydrography, and other selected map features. This map is derived from GIS (geospatial information system) data. It represents a repackaging of GIS data in traditional map form, not creation of new information. The geospatial data in this map are from selected National Map data holdings and other government sources.
Analytic-element groundwater-flow model of the Captain Jack Superfund Site, Boulder County, Colorado
The U.S. Geological Survey (USGS) used an analytic-element method (AEM) modeling approach to quantitatively understand groundwater dynamics at the Captain Jack Superfund Site, located in Boulder County, Colorado. The Captain Jack Superfund Site hosts extensive interconnected underground mine workings.The U.S. Environmental Protection Agency has instituted a remedial strategy of impounding water within the mine workings behind a hydraulic bulkhead in May 2018. The AEM is a grid-less modeling framework where multiple hydrologic stressors may be superimposed upon one another, resulting in a prediction of the bulk system response. This screening-level model could be used for evaluation of boundary conditions, hydraulic...
Probability of suitable habitat for Black Tailed Prairie Dogs for each cell of raster. Probability is measured from 0 to 1 with 0 being low habitat suitability and 1 being high suitability. Probability data is created from fitting a global third-order model to county level raster data. For details on model fitting and data used to produce probability raster see report. https://www.fws.gov/science/catalog
Categories: Data;
Types: Downloadable,
GeoTIFF,
Map Service,
Raster;
Tags: Black Tailed Prairie Dogs,
Boulder County,
Colorado,
Great Plains,
Habitat suitability,
LEFT HAND CREEK NR NIWOT
|

|
