Filters: Tags: California (X) > Date Range: {"choice":"week"} (X)
25 results (2.3s)|
Filters
Date Types (for Date Range)
Types Contacts
Categories Tag Types Tag Schemes |
These datasets provide early estimates of 2024 fractional cover for exotic annual grass (EAG) species and one native perennial grass species on a weekly basis from April to late June. Typically, the EAG estimates are publicly released within 7-13 days of the latest satellite observation used for that version. Each weekly release contains five fractional cover maps along with their corresponding confidence maps for: 1) a group of 16 species of EAGs, 2) cheatgrass (Bromus tectorum); 3) Field Brome (Bromus arvensis); 4) medusahead (Taeniatherum caput-medusae); and 5) Sandberg bluegrass (Poa secunda). These datasets were generated leveraging field observations from Bureau of Land Management (BLM) Assessment, Inventory,...
These datasets provide early estimates of 2024 fractional cover for exotic annual grass (EAG) species and one native perennial grass species on a weekly basis from April to late June. Typically, the EAG estimates are publicly released within 7-13 days of the latest satellite observation used for that version. Each weekly release contains five fractional cover maps along with their corresponding confidence maps for: 1) a group of 16 species of EAGs, 2) cheatgrass (Bromus tectorum); 3) Field Brome (Bromus arvensis); 4) medusahead (Taeniatherum caput-medusae); and 5) Sandberg bluegrass (Poa secunda). These datasets were generated leveraging field observations from Bureau of Land Management (BLM) Assessment, Inventory,...
On February 14th, 2019, a strong atmospheric river storm (AR4 on the Atmospheric River scale of Ralph et al., 2019) struck California. The heavy rainfall caused landslides in both northern and southern California (Hatchett et al., 2020). This data release includes two subsets of mapped shallow landslide source locations in the vicinity of western Riverside County, California, where sufficient post-event imagery was available within Google Earth (image date: August 15, 2019). The data release includes: 1) .csv files containing the point locations of shallow hillslope landslides, 2) .zip files containing shapfiles (.shp) of the mapped study areas. Ralph, F., Rutz, J. J., Cordeira, J. M., Dettinger, M., Anderson,...
Categories: Data;
Tags: Bee Canyon,
California,
Geomorphology,
Riverside County,
USGS Science Data Catalog (SDC),
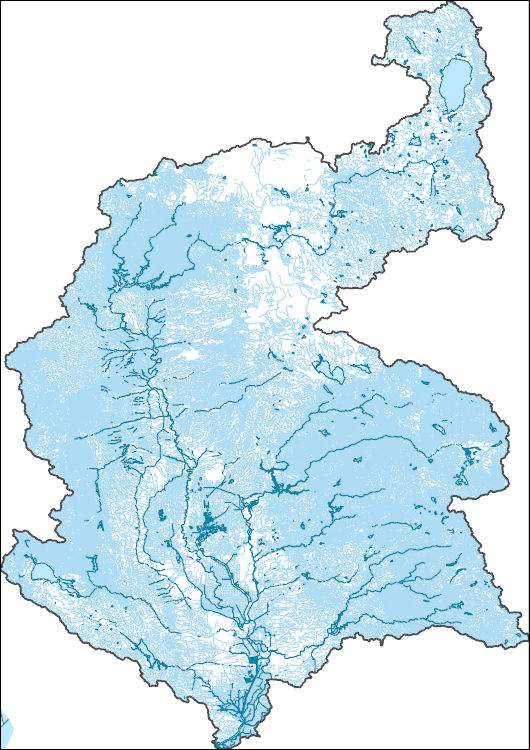
This digital dataset contains groundwater level observations for 364 wells, in addition to well construction information, from 1916 to 2014 in the Central Valley, California. Groundwater level observations are used to create groundwater level contours and to calibrate the groundwater levels for the updated Central Valley Hydrologic Model (CVHM2). Groundwater level observations were collected from five sources (USGS, 2018; SLDMWA, 2018; CADWR, 2004; CRNA, 2018).
Categories: Data;
Types: Downloadable,
Map Service,
OGC WFS Layer,
OGC WMS Layer,
Shapefile;
Tags: California,
Central Valley,
Groundwater,
United States,
Water Level,
The Central Valley, and particularly the San Joaquin Valley, has a long history of land subsidence caused by groundwater development. The extensive withdrawal of groundwater from the unconsolidated deposits of the San Joaquin Valley lowered groundwater levels and caused widespread land subsidence—reaching 9 meters by 1981. More than half of the thickness of the aquifer system is composed of fine-grained sediments, including clays, silts, and sandy or silty clays that are susceptible to compaction. In an effort to aid water managers in understanding how water moves through the aquifer system, predicting water-supply scenarios, and addressing issues related to water competition, the United States Geological Survey...
Post-fire shifts in vegetation composition will have broad ecological impacts. However, information characterizing post-fire recovery patterns and their drivers are lacking over large spatial extents. In this analysis we used Landsat imagery collected when snow cover (SCS) was present, in combination with growing season (GS) imagery, to distinguish evergreen vegetation from deciduous vegetation. We sought to (1) characterize patterns in the rate of post-fire, dual season Normalized Difference Vegetation Index (NDVI) across the region, (2) relate remotely sensed patterns to field-measured patterns of re-vegetation, and (3) identify seasonally-specific drivers of post-fire rates of NDVI recovery. Rates of post-fire...
The Central Valley, and particularly the San Joaquin Valley, has a long history of land subsidence caused by groundwater development. The extensive withdrawal of groundwater from the unconsolidated deposits of the San Joaquin Valley lowered groundwater levels and caused widespread land subsidence—reaching 9 meters by 1981. More than half of the thickness of the aquifer system is composed of fine-grained sediments, including clays, silts, and sandy or silty clays that are susceptible to compaction. In an effort to aid water managers in understanding how water moves through the aquifer system, predicting water-supply scenarios, and addressing issues related to water competition, the United States Geological Survey...
Categories: Data;
Tags: California,
Central Valley,
Interferometric Synthetic Aperture Radar,
Subsidence,
biota
Chronic Wasting Disease distribution in the United States by state and county (ver. 2.0, April 2024)
Chronic Wasting Disease (CWD) is a fatal, contagious, neuro-degenerative disease affecting multiple members of the Family Cervidae. First detected in 1967, the disease has, as of April 2024, been documented in free-ranging and/or captive cervid populations in 33 states, five Canadian provinces, the Republic of South Korea, Norway, Sweden, and Finland. The data provided here contains information on the known, available, documented distribution of CWD in the United States that is current as of the publication date. The USGS National Wildlife Health Center (NWHC) tracks changes to the known distribution of CWD in the form of a map (available on the NWHC website at https://www.usgs.gov/centers/nwhc/science/expanding-distribution-chronic-wasting-disease....
Categories: Data,
Data Release - Revised;
Types: Citation;
Tags: Alabama,
Alaska,
American Samoa,
Arizona,
Arkansas,
The area surrounding La Conchita, California (CA), USA experienced significant landslides and debris flows following a storm on January 10th, 2005, including a deadly deep-seated landslide that destroyed 13 houses and caused 10 fatalities (Jibson, 2006). This data release documents the locations of shallow landslide source locations in the vicinity of the deadly 2005 La Conchita landslide. Landslide locations were mapped as points using post-event imagery available in Google Earth. The data release includes: 1) .csv file containing the point locations of shallow hillslope landslides, 2) .zip file containing shapefile (.shp) of the mapped study area. References: Jibson, R. W. (2006). The 2005 La Conchita, California,...
Categories: Data;
Tags: California,
Geomorphology,
La Conchita,
USGS Science Data Catalog (SDC),
United States,
A three-dimensional groundwater flow model of the Central Valley in California was developed to aid water managers in understanding how water moves through the aquifer system, to predict water-supply scenarios, and to address issues related to subsidence. The USGS California Water Science Center made a detailed assessment of groundwater availability of the Central Valley aquifer system, which includes: (1) the status of groundwater resources; (2) how these resources have changed over time, particularly related to subsidence; and (3) tools to assess system responses to stresses from future human uses and climate variability and change. This effort builds on previous investigations, such as the USGS Central Valley...
Categories: Data;
Tags: California,
Central Valley,
Corcoran Clay,
Sacramento Valley,
San Joaquin Basin,
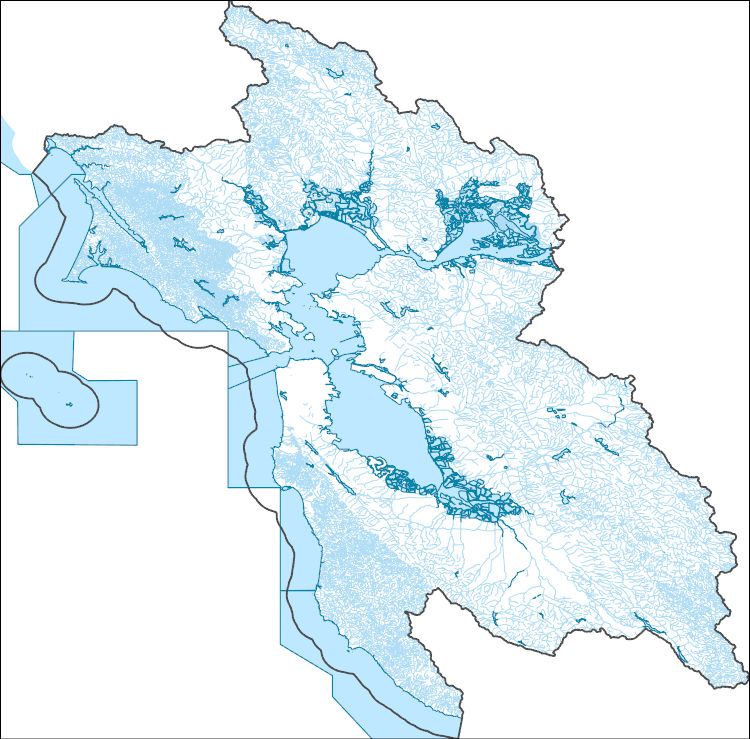
The High Resolution National Hydrography Dataset Plus (NHDPlus HR) is an integrated set of geospatial data layers, including the best available National Hydrography Dataset (NHD), the 10-meter 3D Elevation Program Digital Elevation Model (3DEP DEM), and the National Watershed Boundary Dataset (WBD). The NHDPlus HR combines the NHD, 3DEP DEMs, and WBD to create a stream network with linear referencing, feature naming, "value added attributes" (VAAs), elevation-derived catchments, and other features for hydrologic data analysis. The stream network with linear referencing is a system of data relationships applied to hydrographic systems so that one stream reach "flows" into another and "events" can be tied to and traced...
These data are monthly median observed streamflow from 32 gages in the Central Valley for comparison to the updated Central Valley Hydrologic Model (CVHM2). The locations of these gages are shown in the shape file.
Categories: Data;
Types: Downloadable,
Map Service,
OGC WFS Layer,
OGC WMS Layer,
Shapefile;
Tags: California,
Central Valley,
United States,
datasets,
stream-gage measurement,
The Central Valley, and particularly the San Joaquin Valley, has a long history of land subsidence caused by groundwater development. The extensive withdrawal of groundwater from the unconsolidated deposits of the San Joaquin Valley lowered groundwater levels and caused widespread land subsidence—reaching 9 meters by 1981. More than half of the thickness of the aquifer system is composed of fine-grained sediments, including clays, silts, and sandy or silty clays that are susceptible to compaction. In an effort to aid water managers in understanding how water moves through the aquifer system, predicting water-supply scenarios, and addressing issues related to water competition, the United States Geological Survey...
The Central Valley, and particularly the San Joaquin Valley, has a long history of land subsidence caused by groundwater development. The extensive withdrawal of groundwater from the unconsolidated deposits of the San Joaquin Valley lowered groundwater levels and caused widespread land subsidence—reaching 9 meters by 1981. More than half of the thickness of the aquifer system is composed of fine-grained sediments, including clays, silts, and sandy or silty clays that are susceptible to compaction. In an effort to aid water managers in understanding how water moves through the aquifer system, predicting water-supply scenarios, and addressing issues related to water competition, the United States Geological Survey...
These datasets provide early estimates of 2024 fractional cover for exotic annual grass (EAG) species and one native perennial grass species on a weekly basis from April to late June. Typically, the EAG estimates are publicly released within 7-13 days of the latest satellite observation used for that version. Each weekly release contains five fractional cover maps along with their corresponding confidence maps for: 1) a group of 16 species of EAGs, 2) cheatgrass (Bromus tectorum); 3) Field Brome (Bromus arvensis); 4) medusahead (Taeniatherum caput-medusae); and 5) Sandberg bluegrass (Poa secunda). These datasets were generated leveraging field observations from Bureau of Land Management (BLM) Assessment, Inventory,...
Categories: Data;
Types: Downloadable,
GeoTIFF,
Map Service,
Raster;
Tags: Arizona,
California,
Colorado,
Field Brome,
Great Basin,
The Central Valley, and particularly the San Joaquin Valley, has a long history of land subsidence caused by groundwater development. The extensive withdrawal of groundwater from the unconsolidated deposits of the San Joaquin Valley lowered groundwater levels and caused widespread land subsidence—reaching 9 meters by 1981. More than half of the thickness of the aquifer system is composed of fine-grained sediments, including clays, silts, and sandy or silty clays that are susceptible to compaction. In an effort to aid water managers in understanding how water moves through the aquifer system, predicting water-supply scenarios, and addressing issues related to water competition, the United States Geological Survey...
This digital dataset includes three sets of observational data (groundwater level, streamflow, subsidence) used to calibrate the updated Central Valley Hydrologic Model (CVHM2)
Categories: Data Release - Revised;
Tags: California,
Central Valley,
Observation,
Streamflow,
Subsidence,
An updated version has been published: Halstead, B.J., Kleeman, P.M., and Rose, J.P., 2024, Northwestern pond turtle survey data in northern California forest streams, 2021-2022: U.S. Geological Survey data release, https://doi.org/10.5066/P96GAPCC. These data are from joint visual encounter and environmental DNA (eDNA) surveys conducted for northwestern pond turtles (Actinemys marmorata) in streams on privately-owned timberlands in northern California.
The High Resolution National Hydrography Dataset Plus (NHDPlus HR) is an integrated set of geospatial data layers, including the best available National Hydrography Dataset (NHD), the 10-meter 3D Elevation Program Digital Elevation Model (3DEP DEM), and the National Watershed Boundary Dataset (WBD). The NHDPlus HR combines the NHD, 3DEP DEMs, and WBD to create a stream network with linear referencing, feature naming, "value added attributes" (VAAs), elevation-derived catchments, and other features for hydrologic data analysis. The stream network with linear referencing is a system of data relationships applied to hydrographic systems so that one stream reach "flows" into another and "events" can be tied to and traced...

This model has been superseded by an updated version of the model. The new model can be found at: https://doi.org/10.5066/P99KJ1U1, https://doi.org/10.5066/P9FTZ5RW, https://doi.org/10.5066/P9NBWLYX, https://doi.org/10.5066/P97XBULI, https://doi.org/10.5066/P980EHWV, https://doi.org/10.5066/P95XLBB5, https://doi.org/10.5066/P9ICSZWF, https://doi.org/10.5066/P96LJ01V, and https://doi.org/10.5066/P9IZRO3V. A three-dimensional groundwater flow model (MODFLOW200-FMP1_1) of the Central Valley in California was developed to aid water managers in understanding how water moves through the aquifer system, to predict water-supply scenarios, and to address issues related to water competition. The USGS Groundwater Resources...
Categories: pre-SM502.8;
Tags: California,
Central Valley,
Corcoran Clay,
Groundwater,
Groundwater Model,
|

|
