Filters: Tags: California (X)
22,155 results (47ms)|
Filters
Date Range
Extensions Types
Contacts
Categories Tag Types
|

The Nature Conservancy (TNC) has derived climate suitability forecasts for most species of trees and shrubs considered to be ecological dominants of terrestrial Californian habitat types. Our plant projections are compiled as decision support tools to help Conservancy project staff, as well as our external partners, develop the necessary plans, priorities and strategies to successfully adapt to uncertain changes in future climate. In the recently completed Southern Sierra Partnership's 2010 Climate-Adapted Conservation Plan for the Southern Sierra Nevada and Tehachapi Mountains, species and habitat forecasts shown here informed the development of a regional conservation design that explicitly incorporates long-term...

This product is one of a set of mapped model simulation results generated for a project called "Global Climate Change and California: Potential Implications for Ecosystems, Health, and the Economy". The project was conducted by the Electrical Power Research Institute (EPRI) and funded by the California Energy Commission's Public Interest Energy Research (PIER) Program. The project was the most detailed study ever undertaken on the potential effect of climate change on California. The work examined a broad array of potentially affected sectors as well as the interactions between climate change and increased population, economic growth, and technological change. It considered a wide range of climate change scenarios,...

This product is one of a set of mapped model simulation results generated for a project called “Global Climate Change and California: Potential Implications for Ecosystems, Health, and the Economy”. The project was conducted by the Electrical Power Research Institute (EPRI) and funded by the California Energy Commission’s Public Interest Energy Research (PIER) Program. The project was the most detailed study ever undertaken on the potential effect of climate change on California. The work examined a broad array of potentially affected sectors as well as the interactions between climate change and increased population, economic growth, and technological change. It considered a wide range of climate change scenarios,...

These data identify, in general, the areas where final critical habitat for Castilleja cinerea (Ash-gray Indian paintbrush) occur.

Winter (January – March) precipitation averaged over 2046-2065 from the general circulation model PCM1 (Washington et al. 2000; Meehl et al. 2003) under the A2 emission scenario with a grid cell size of 10 km x 10km. References: Meehl, G.A., W.M. Washington, T.M.L. Wigley, J.M. Arblaster, and A. Dai. 2003. Solar and greenhouse gas forcing and climate response in the twentieth century. J Climate 16:426–444. Washington, W.M., J.W. Weatherly, G.A. Meehl, A.J. Semtner, T.W. Bettge, A.P. Craig, W.G. Stran, J. Arblaster, V.B. Wayland, R. James , and Y. Zhang. 2000. Parallel climate model (PCM) control and transient simulations. Clim Dyn 16: 755–774.

Winter (January – March) precipitation (mm) averaged over 2046-2065 from the general circulation model Hadley CM3 (Gordon et al. 2000, Pope et al. 2000) downscaled to a grid cell size of 10 km x 10km. References: Gordon C., C. Cooper , C.A. Senior, H. Banks, J.M. Gregory, T.C. Johns , J.F.B. Mitchell, and R.A. Wood. 2000. The simulation of SST, sea ice extents and ocean heat transports in a version of the Hadley Centre coupled model without flux adjustments. Clim Dyn 16:147–168. Pope, V.D., M.L. Gallani, P.R. Rowntree, and R.A. Stratton. 2000. The impact of new physical parameterisations in the Hadley Centre climate model – HadAM3. Clim Dyn 16:123–146.

Future (2046-2065) predicted probability of fisher year-round occurrence projected under the A1fi emissions scenario with the Hadley CM3 GCM model (Gordon et al. 2000, Pope et al. 2000). Projected fisher distribution was created with Maxent (Phillips et al. 2006) using fisher detections (N = 102, spanning 1993 – 2011) and seven predictor variables: mean winter (January – March) precipitation, mean summer (July – September) precipitation, mean summer temperature amplitude, mean daily low temperature for the month of the year with the warmest mean daily low temperature, mean fraction of vegetation carbon burned, mean vegetation carbon (g C m2), and modal vegetation class. Predictor variables had a grid cell size of...
Description: Predicted probability of fisher year-round occurrence created with Maxent (Phillips et al. 2006) using fisher detections (N = 102, spanning 1993 – 2011) and seven predictor variables: mean winter (January – March) precipitation, mean summer (July – September) precipitation, mean summer temperature amplitude, mean daily low temperature for the month of the year with the warmest mean daily low temperature, mean fraction of vegetation carbon burned, mean vegetation carbon (g C m2), and modal vegetation class. Predictor variables had a grid cell size of 10 km, vegetation variables were simulated with MC1 (Hayhoe et al. 2004) and climate variables were provided by the PRISM GROUP (Daly et al. 1994). This...

This dataset shows the locations of sensitive plant species mapped by CBI on the Crestridge Ecological Reserve in 2009.

Annual precipitation (mm) averaged over 1986 – 2005, simulated by the MC1 dynamic global vegetation model (Bachelet et al. 2001) at a 4 km x 4 km spatial resolution using PRISM climate for the historical period. This effort is part of a pilot project to apply and evaluate the Yale Framework (Yale Science Panel for Integrating Climate Adaptation and Landscape Conservation Planning). Note: The MC1 model is described in data basin (http://databasin.org/climate-center/features/mc1-dynamic-global-vegetation-model).

The source of this coverage data set is the fish biodiversity maps created for The Nature Conservancy (TNC) as part of their Hexagon Project. Professor Peter Moyle and his graduate student, Paul Randall, of the Department of Wildlife and Fisheries Conservation Biology at the University of California, Davis were hired to produce range maps for all known fish species that presently occur in California. Each coverage denotes a separate fish species (refer to the species coverage key below). The polygons are estimated to be accurate at a scale of roughly 1:1,000,000. Other California fish species distributions can be found in a gallery at: http://app.databasin.org/app/pages/galleryPage.jsp?id=099b47b7394f47b6b42764829e8a8f09
Future climates are simulated by general circulation models (GCM) using climate change scenarios (IPCC 2014). To project climate change for the sagebrush biome, we used 11 GCMs and two climate change scenarios from the IPCC Fifth Assessment, representative concentration pathways (RCPs) 4.5 and 8.5 (Moss et al. 2010, Van Vuuren et al. 2011). RCP4.5 scenario represents a future where climate policies limit and achieve stabilization of greenhouse gas concentrations to 4.5 W m-2 by 2100. RCP8.5 scenario might be called a business-as-usual scenario, where high emissions of greenhouse gases continue in the absence of climate change policies. The two selected time frames allow comparison of near-term (2020-2050) and longer-term...
Categories: Data;
Types: Citation,
Downloadable,
GeoTIFF,
Map Service,
Raster;
Tags: Arizona,
CRS,
California,
Climate,
Colorado,

Simulated fraction of vegetation carbon in forest averaged over 2076-2095 simulated by the MC1 dynamic global vegetation model (Bachelet et al. 2001) at a 800 m x 800 m spatial resolution using future climate projections provided through CMIP3 (http://www-pcmdi.llnl.gov/ipcc/about_ipcc.php). Future climate drivers were generated using statistical downscaling (simple delta method) of general circulation model projections, in this case Hadley CM3 (Johns et al. 2003) under the A2 emission scenario (Naki?enovi? et al. 2000). The deltas (differences for temperatures and ratios for precipitation) were used to modify PRISM 800 m historical baseline (Daly et al. 2008). Note: The MC1 model is described in data basin...

Simulated fraction of vegetation carbon in forest averaged over 2046-2065 simulated by the MC1 dynamic global vegetation model (Bachelet et al. 2001) at a 800 m x 800 m spatial resolution using future climate projections provided through CMIP3 (http://www-pcmdi.llnl.gov/ipcc/about_ipcc.php). Future climate drivers were generated using statistical downscaling (simple delta method) of general circulation model projections, in this case CSIRO Mk3 A2 (Gordon 2002) under the A2 emission scenario (Naki?enovi? et al. 2000). The deltas (differences for temperatures and ratios for precipitation) were used to modify PRISM 800 m historical baseline (Daly et al. 2008). Note: The MC1 model is described in data basin (http://databasin.org/climate-center/features/mc1-dynamic-global-vegetati...
This product is the result of a comprehensive compilation of site-specific ground photographs taken where tectonic faulting and ground failure produced visible deformation that fractured and disturbed the ground surface. The resultant data is distributed as collection of JPEG image files. All post-earthquake photographs taken by investigators working for public agencies are in the public domain, including data that have been published in summary reports elsewhere. These photographs are best viewed in context with fault rupture and other observations from the related KMZ file of summary field observations and photographs (https://www.sciencebase.gov/catalog/item/5c1d7ae0e4b0708288ca1322), or from the associated open-file...
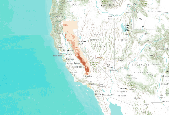
This dataset consists of 65 magnetotelluric (MT) stations collected in 2015 near Mountain Pass, California. The U.S. Geological Survey acquired these data to create a regional conductivity model near the Mountain Pass mine. This work is in support of characterizing mineral deposits.
Five principal components are used to represent the climate variation in an original set of 12 composite climate variables reflecting complex precipitation and temperature gradients. The dataset provides coverage for future climate (defined as the 2040-2070 normal period) under the RCP4.5 emission scenarios. Climate variables were chosen based on their known influence on local adaptation in plants, and include: mean annual temperature, summer maximum temperature, winter minimum temperature, annual temperature range, temperature seasonality (coefficient of variation in monthly average temperatures), mean annual precipitation, winter precipitation, summer precipitation, proportion of summer precipitation, precipitation...
Categories: Data;
Types: Downloadable,
GeoTIFF,
Map Service,
Raster;
Tags: Arizona,
California,
Colorado,
Colorado Plateau,
Great Basin,
This dataset provides timeseries data on water quality and quantity, as collected or computed from outside sources. The format is many tables with one row per time series observation (1 tab-delimited file per site-variable combination, 1 zip file per site). This compilation of data is intended for use in estimating or interpreting metabolism. Sites were included if they met the initial criteria of having at least 100 dissolved oxygen observations and one of the accepted NWIS site types ('ST','ST-CA','ST-DCH','ST-TS', or 'SP'). This dataset is part of a larger data release of metabolism model inputs and outputs for 356 streams and rivers across the United States (https://doi.org/10.5066/F70864KX). The complete release...
|

|
