Filters: Tags: California (X)
21,320 results (106ms)|
Filters
Date Range
Extensions Types
Contacts
Categories Tag Types
|
The 'REA Gold Corporation Corporate Profile and Annual Report 1983' file is part of the A. F. Budge Mining Ltd. Mining collection. A. F. Budge Mining Ltd., a British company owned by Tony Budge, controlled properties across several western U. S. states and northern Mexico. The company was active in Arizona during the 1980s and into the early 1990s. The collection consists of economic geologic information including maps, logs, reports and records. A few properties make up most of the collection: Vulture, United Verde Extension and Korn Kob.
Compressional- (P-) wave seismic refraction data were acquired in December 2018 and July 2019 along fourteen profiles within the spillway of Success Dam in Porterville, California. A new concrete ogee weir is planned for construction within the existing spillway, and the P-wave seismic velocity models will be used to inform further geotechnical investigations, including siting new geologic borings, and the advanced engineering design phases in terms of rock rippability and relative rock hardness/competency. Data acquisition, processing, and modeling were conducted collaboratively between the U.S. Geological Survey (USGS) and U.S. Army Corps of Engineers (USACE) Sacramento District. Data were acquired with Geometrics...
Categories: Data;
Tags: California,
GGGSC,
Geology, Geophysics, and Geochemistry Science Center,
Lake Success,
Porterville,
Locations of railroad lines for 11 western states. The Bureau of Transportation Statistics 1:100k Railroads line network was clipped to the boundary of the 11 Western States.
In 30 surveys, we mapped 21,486 birds comprising 88 species “interact with” the intertidal habitat. Each full “survey” represents a unique month-year-tide combination (but not necessarily a unique day). Specifically, for each of 15 months between January 2012 and March 2013 we conducted separate, but temporally adjacent high-tide and low-tide bird surveys (30 in total) throughout the intertidal habitats. Back to back surveys within the same month are not meant to be independent measures of bird abundance and should be averaged to get an idea of bird abundance in a particular month. Birds were counted if they were in the intertidal habitat. We also counted some species, like raptors, if they were perched in adjacent...
Categories: Data;
Types: Citation,
Downloadable,
Map Service,
OGC WFS Layer,
OGC WMS Layer,
Shapefile;
Tags: California,
Carpinteria,
Carpinteria Salt Marsh Reserve,
Santa Barbara County,
bird,
New active-source shallow seismic (shear-wave and acoustic-wave) measurements were obtained at 18 prioritized seismic monitoring station locations in the north San Francisco Bay area to measure site-specific ground motion amplification effects, soil depth, depth to bedrock (Z1.0 Vs=1 km/s), calculate site specific velocity-depth profiles and Vs30, and develop NEHRP site classifications for each location. This study was led by Principal Investigators Jamey Turner, Cooper Brossy, and Daniel O’Connell and field data were acquired by Glendon Adams and Lincoln Steele. Seismic monitoring sites that recorded high PGA values during the M6.0 Napa earthquake, proximal to higher population densities, and sites recommended...
Categories: Data;
Types: Citation,
Downloadable,
Map Service,
OGC WFS Layer,
OGC WMS Layer,
Shapefile;
Tags: California,
EHP,
Earthquake Hazards Program,
GHSC,
Geologic Hazards Science Center,
Future climates are simulated by general circulation models (GCM) using climate change scenarios (IPCC 2014). To project climate change for the sagebrush biome, we used 11 GCMs and two climate change scenarios from the IPCC Fifth Assessment, representative concentration pathways (RCPs) 4.5 and 8.5 (Moss et al. 2010, Van Vuuren et al. 2011). RCP4.5 scenario represents a future where climate policies limit and achieve stabilization of greenhouse gas concentrations to 4.5 W m-2 by 2100. RCP8.5 scenario might be called a business-as-usual scenario, where high emissions of greenhouse gases continue in the absence of climate change policies. The two selected time frames allow comparison of near-term (2020-2050) and longer-term...
Categories: Data;
Types: Citation,
Downloadable,
GeoTIFF,
Map Service,
Raster;
Tags: Arizona,
CRS,
California,
Climate,
Colorado,
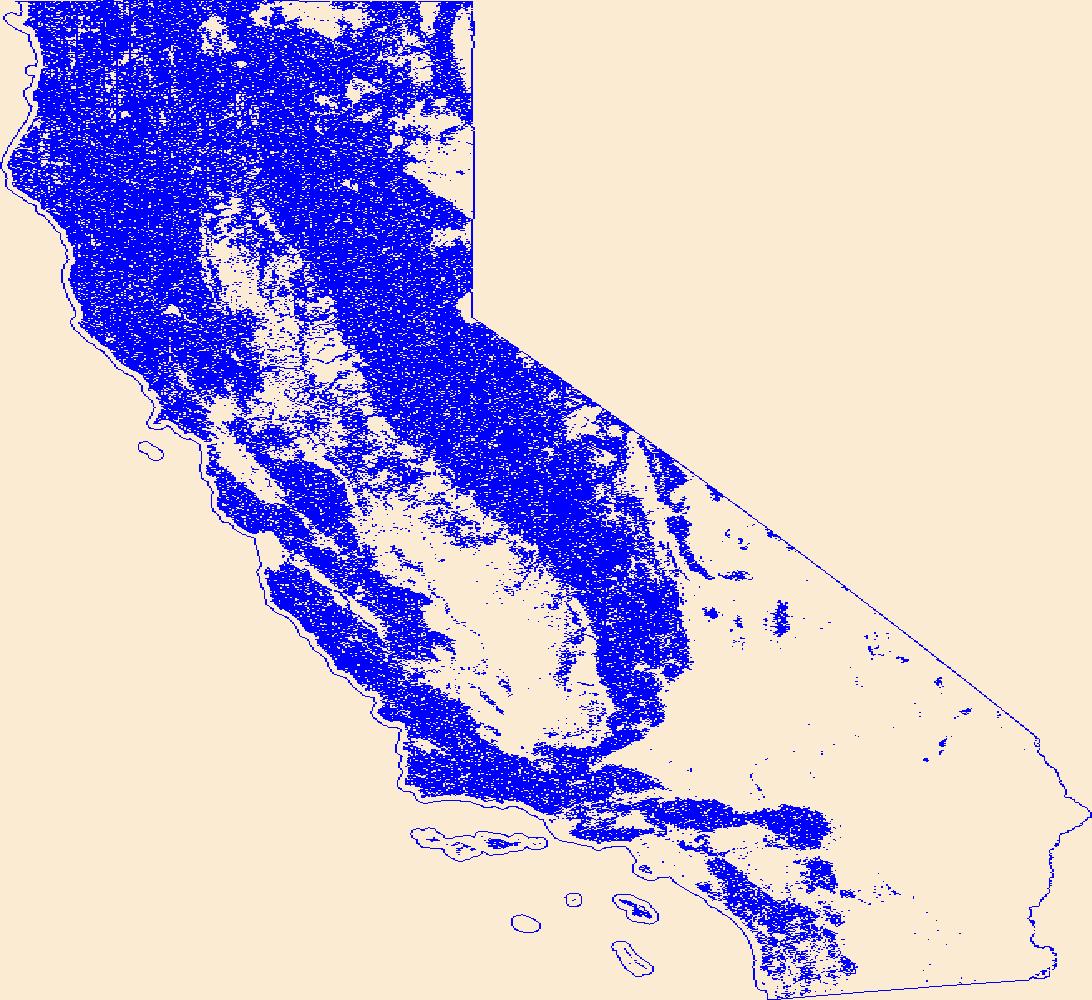
Geospatial data that is a derivative land cover product depicting woodland on topographic maps.
This shapefile is the official boundary of the Western Native Trout Initiative. The boundary was originally developed by the United States Fish and Wildlife Service and was updated in 2013 to reflect revisions from the Western Native Trout Initiative, a recognized Fish Habitat Partnership (FHP) of the National Fish Habitat Partnership.
Categories: Data;
Types: ArcGIS REST Map Service,
ArcGIS Service Definition,
Downloadable,
Map Service;
Tags: Alaska,
Analytical boundary,
Aquatic habitats,
Arizona,
Boundaries,
This dataset consists of 65 magnetotelluric (MT) stations collected in 2015 near Mountain Pass, California. The U.S. Geological Survey acquired these data to create a regional conductivity model near the Mountain Pass mine. This work is in support of characterizing mineral deposits.
This raster represents a continuous surface of sage-grouse habitat suitability index (HSI) values for northeastern California. HSIs were calculated for spring (mid-March to June), summer (July to mid-October), and winter (November to March) sage-grouse seasons, and then multiplied together to create this composite dataset.
Categories: Data;
Types: Downloadable,
GeoTIFF,
Map Service,
Raster;
Tags: California,
Great Basin,
Greater Sage-Grouse,
Habitat,
Nevada,
This shapefile defines the two distinct zones within the 2013 boundary of the Pacific Marine and Estuarine Fish Habitat Partnership (PMEP), a recognized Fish Habitat Partnership (FHP) of the National Fish Habitat Partnership (NFHP). The two zones of the PMEP include the estuarine and marine nearshore complex (PMEP focus area, coastal subregions, and nearshore marine waters) of the states of California, Oregon, and Washington.
Categories: Data;
Types: ArcGIS REST Map Service,
ArcGIS Service Definition,
Downloadable,
Map Service;
Tags: Analytical boundary,
Aquatic habitats,
Boundaries,
California,
FHP Boundary,
Climate Distance Mapper is an interactive web mapping application designed to facilitate informed seed sourcing decisions and to aid in directing regional seed collections. Implemented as a shiny web application (Chang et al. 2017), Climate Distance Mapper is hosted on the web at: https://usgs-werc-shinytools.shinyapps.io/Climate_Distance_Mapper/. The application is designed to guide restoration seed sourcing in the desert southwest by allowing users to interactively match seed sources with restoration sites climatic differences – in the form of multivariate climate distance values – between restoration sites and the surrounding landscape. Climatic distances are based on a combination of variables likely to influence...
This dataset consists of 42 magnetotelluric (MT) stations collected in 2017 in the Northwest Geysers, CA. The U.S. Geological Survey acquired these data as part of a project to image the heat source in the Northwest Geysers. Support was from the U.S. Geological Survey's Volcano Hazards Program.
This dataset consists of 42 magnetotelluric (MT) stations collected in 2017 in the Northwest Geysers, CA. The U.S. Geological Survey acquired these data as part of a project to image the heat source in the Northwest Geysers. Support was from the U.S. Geological Survey's Volcano Hazards Program.
This dataset consists of 42 magnetotelluric (MT) stations collected in 2017 in the Northwest Geysers, CA. The U.S. Geological Survey acquired these data as part of a project to image the heat source in the Northwest Geysers. Support was from the U.S. Geological Survey's Volcano Hazards Program.
This dataset consists of 42 magnetotelluric (MT) stations collected in 2017 in the Northwest Geysers, CA. The U.S. Geological Survey acquired these data as part of a project to image the heat source in the Northwest Geysers. Support was from the U.S. Geological Survey's Volcano Hazards Program.
This dataset consists of 14 magnetotelluric (MT) stations collected in 2015 near San Pablo Bay, California along a east-northeast profile. The U.S. Geological Survey acquired these data to understand the fault geometry of the Hayward Fault and the Rodgers Creek Fault.
|

|
