Filters: Tags: Canada (X)
900 results (96ms)|
Filters
Date Range
Extensions Types Contacts
Categories
Tag Types
|
This sampling frame is a set of grid-based finite-area frames spanning Canada, the United States, and Mexico. The grid for the United States is broken into individual grids for the continental United States, Hawaii, and Puerto Rico. Alaska is combined with Canada into a single grid. Each country/state/territory extent consists of four nested sampling grids at 50x50km, 10x10km, 5x5km, and 1x1km resolutions. The original 10x10km continental United States grid was developed by the Forest Service, U.S. Department of Agriculture for use in the interagency “Bat Grid” monitoring program in the Pacific Northwest and was expanded across Canada, the United States, and Mexico for the North American Bat Monitoring Program (NABat)....
Categories: Data;
Types: Downloadable,
Map Service,
OGC WFS Layer,
OGC WMS Layer,
Shapefile;
Tags: Alaska,
Canada,
Hawaii,
Mexico,
Puerto Rico,
Coalbed methane is one of the most important and valuable natural resources in the Western United States. The natural gas that results from CBM development is the cleanest burning fossil fuel, and the extensive domestic supply makes it a central element of the national goal of a secure supply of energy. Demand for natural gas will continue to grow and CBM will play an increasingly larger role in meeting that demand. CBM production has expanded tremendously over the past decade, and the rapidity with which development has expanded has resulted in stresses and tension in affected communities. Development of this important energy resource must be balanced with a number of other important goals of protecting water,...
Categories: Publication;
Types: Citation;
Tags: Canada,
Commentary,
Information,
considerations,
diamond,
The paper investigates whether the Clean Development Mechanism (CDM) under the Kyoto Protocol has played a significant role in the development of rural communities, specifically investigating uptake of small-scale renewable energy projects. The investigation involved an assessment of 500 registered small-scale CDM projects under the Kyoto Protocol in terms of their potential impact on the envisaged sustainable development goals for rural communities. Five case studies from the Indian subcontinent were also examined. The paper concludes that the CDM in its current state and design has typically failed to deliver the promised benefits with regard to development objectives in rural areas. Successful projects were found...

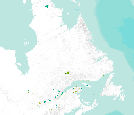
This layer is part of the Geological Survey of Canada's earthquake monitoring network. There are some blank fields toward the beginning of the listing, from the time the network was being installed and hence parameters were often unknown. Also, all depths in the table are "fixed" to a depth which is an integer multiple of 5km, according to lowest obtainable residuals and known crustal structure. The number and magnitude of located events are also dependent on the time recorded, as the magnitude threshold lowered as more stations were installed. The larger, potentially damaging earthquakes, however, were likely recorded from the inception of the network as these events produce waves which reach the entire western...

Extent of disturbance directly related to oil sands surface mining activity up to 2002.
The datatset is a compilation of all permanent (legally established) protected areas in Quebec, Canada.

This dataset depicts known contaminated sites under the jurisdiction of Canada's federal agencies and consolidated Crown corporations, including non-federal sites for which the Government of Canada has accepted some or all financial responsibility. A contaminated sites is defined as "one at which substances occur at concentrations (1) above background (normally occurring) levels and pose or are likely to pose an immediate or long term hazard to human health or the environment, or (2) exceeding levels specified in policies and regulations." (http://www.tbs-sct.gc.ca/fcsi-rscf/home-accueil.aspx?Language=EN&sid=wu1281891127). This dataset was created by the Conservation Biology Institute using publicly available information...

Digital polling division boundaries for 2004 were compared to polling division boundaries for 2006 and 2008 for select federal electoral districts. Polling divisions were identified by change type: larger than the comparison year, smaller than the comparison year, no change, and new division. Original polling division data was downloaded in December of 2009 from: http://geogratis.cgdi.gc.ca/geogratis/en/option/select.do?id=1169 NOTES: Be aware that polygons marked as no change that show boundary changes between the two comparison years can be 1) subdivided in one year and not the other, or 2) have an area difference of less than 1000 square meters. Polling divisions were identified based on the federal electoral...
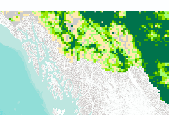
This dataset contains Canada's national forest inventory (CanFI) 2001 data for plots within the boreal region of the province of British Columbia. The attribute displayed is percent forested. Refer to the "attributes" tab to view other attributes contained in this dataset. For more information, refer to the CanFI 2001 document at: http://dsp-psd.pwgsc.gc.ca/collection_2007/nrcan-rncan/Fo143-2-408E.pdf From CanFI: Canada's existing national forest inventory (CanFI) is compiled about every five years by aggregating provincial and territorial forest management inventories and reconnaissance level information. Stand-level data provided by the provincial and territorial management agencies are converted to a national...

The mapping of land capability for forestry is based on a national classification system comparable with the other Canada Land Inventory sectors. Land is rated according to seven classes on its capability to grow commercial timber in areas stocked with the optimum number and species of trees. This rating considers the land in its natural state, without improvements such as fertilization, drainage, or amelioration practices. This dataset contains Land Capability Ratings for the surveyed portions of the province of British Columbia. Land ratings and classes may change, however, significant changes will only be achieved through costly and continuing practices. The best lands for tree growth are Class 1 while Class...

This dataset depicts the Level III ecological regions of North America, as compiled by the Commission for Environmental Cooperation (CEC). These draft files of of Level I, II, and III ecological regions of North America are an update and revision of files developed by Canada, the United States, and Mexico in the late 1990's in a cooperative project for the Commission for Environmental Cooperation (CEC 1997). The CEC was created under the North American Agreement on Environmental Cooperation (NAAEC) to address regional environmental concerns, help prevent potential trade and environmental conflicts and promote the effective enforcement of environmental law. The Agreement complements the environmental provisions established...
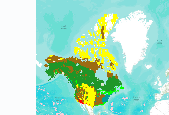
These results come from the VINCERA version of MC1. MC1 is a dynamic vegetation model for estimating the distribution of vegetation and associated ecosystem fluxes of carbon, nutrients, and water. It was created to assess the potential impacts of global climate change on ecosystem structure and function at a wide range of spatial scales from landscape to global. The model incorporates transient dynamics to make predictions about the patterns of ecological change. MC1 was created by combining physiologically based biogeographic rules defined in the MAPSS model with a modified version of the biogeochemical model, CENTURY. MC1 includes a fire module, MCFIRE, that mechanistically simulates the occurrence and impacts...

This dataset contains generalized landcover data for the Prairie Farm Rehabilitation Administration (PFRA) agricultural extent of Alberta and British Columbia. This dataset was subset into two shapefiles. The other half of this dataset covers PFRA agricultural areas of Manitoba and Saskatchewan. The Landcover Generalization process was undertaken to solve rendering problems of the original vectorized landcover data due to its unwieldy/overwhelming size. LANDSAT 7 imagery used in the process was collected during the WGTPP. This landcover imagery has a 30 meter resolution and is stored in over 1,100 vectorized 1:50,000 map sheet tiles. The data requires over seven gigabytes of disc space. If the user wishes to view...

Average monthly maximum temperature for the years 2070-2099.
This shapefile is the official boundary of the Great Lakes Basin Fish Habitat Partnership. The boundary was originally developed by the United States Fish and Wildlife Service and was updated in 2013 to reflect revisions from the Southeast Aquatic Resource Partnership, a recognized Fish Habitat Partnership (FHP) of the National Fish Habitat Partnership.
Categories: Data;
Types: ArcGIS REST Map Service,
ArcGIS Service Definition,
Downloadable,
Map Service;
Tags: Analytical boundary,
Aquatic habitats,
Boundaries,
Canada,
FHP Boundary,

This study focuses on Endangered Forests and the biological components of the High Conservation Value Forest concept. High Conservation Value and Endangered Forests are identified and mapped based on several ecological components that are globally, regionally, or locally important. These ecological components can be landscape level features or biodiversity related. These components sometimes overlap and at other times are mutually exclusive. Any one component can be enough to identify a specific forest area as a High Conservation Value or Endangered Forest depending on the circumstance, but a full assessment using readily available spatial data of all of the ecological components is warranted before a forest is...

MC1 is a dynamic vegetation model for estimating the distribution of vegetation and associated ecosystem fluxes of carbon, nutrients, and water. It was created to assess the potential impacts of global climate change on ecosystem structure and function at a wide range of spatial scales from landscape to global. The model incorporates transient dynamics to make predictions about the patterns of ecological change. MC1 was created by combining physiologically based biogeographic rules defined in the MAPSS model with a modified version of the biogeochemical model, CENTURY. MC1 includes a fire module, MCFIRE, that mechanistically simulates the occurrence and impacts of fire events. Climate input data sources for this...

MC1 is a dynamic vegetation model for estimating the distribution of vegetation and associated ecosystem fluxes of carbon, nutrients, and water. It was created to assess the potential impacts of global climate change on ecosystem structure and function at a wide range of spatial scales from landscape to global. The model incorporates transient dynamics to make predictions about the patterns of ecological change. MC1 was created by combining physiologically based biogeographic rules defined in the MAPSS model with a modified version of the biogeochemical model, CENTURY. MC1 includes a fire module, MCFIRE, that mechanistically simulates the occurrence and impacts of fire events. Climate input data sources for this...
Approximately 1,900 line square kilometers of imagery were collected using a HyMap™ sensor (Cocks and others, 1998) mounted on a modified Piper Navajo aircraft. The aircraft was flown at an altitude of approximately 5,050 m (3,480 m above the mean ground surface elevation of 1570 m) resulting in average ground spatial resolution of 6.7 m. Solar elevation and azimuth angles ranged from 42.0-48.3° (average 46.2°) and 134.2-182.4° (average 155°), respectively. HyMap measured reflected sunlight in 126 narrow channels that cover the wavelength region of 455 to 2,483 nm. Data were delivered by the operators of the sensor (HyVista Corp., Australia) in units of radiance (data are available in Kokaly and others, 2017)....
Reflectance data from HyMap™ were processed using the Material Identification and Characterization Algorithm (MICA), a module of the USGS PRISM (Processing Routines in IDL for Spectroscopic Measurements) software (Kokaly, 2011), programmed in Interactive Data Language (IDL; Harris Geospatial Solutions, Broomfield, Colorado). The HyMap reflectance data are provided and described in this data release. MICA identifies the spectrally predominant mineral(s) in each pixel of imaging spectrometer data by comparing continuum-removed spectral features in the pixel’s reflectance spectrum to continuum-removed absorption features in reference spectra of minerals, vegetation, water, and other materials. Linear continuum removal...
Categories: Data;
Types: Downloadable,
GeoTIFF,
Map Service,
Raster;
Tags: Alaska,
Alaska,
Alaska Range,
Bond Creek,
Canada,
|

|
