Filters: Tags: Carlton County (X)
120 results (207ms)|
Filters
Contacts
(Less)
|
This dataset provides a subset of well construction information provided by the driller's well logs. Complete well logs can be accessed on the Minnesota Well Index online (http://www.health.state.mn.us/ divs/eh/cwi/).
Categories: Data;
Tags: Anoka County,
Becker County,
Beltrami County,
Carlton County,
Carver County,
This dataset provides aqueous nitrate+nitrite, aqueous manganese, aqueous iron, and total sulfate measurements in groundwater samples from 254 newly constructed private residential wells between 2014 and 2016. The study focuses on three geologically distinct regions of Minnesota: central, northwest, and northeast. These study regions were chosen due to their prevalent elevated As concentrations in drinking water. Each of the 254 wells were sampled in three rounds by the Minnesota Department of Health (MDH). The timing of the three sampling rounds was (1) immediately or shortly after well construction (round 1); (2) 3-6 months after initial sample collection (round 2); and (3) 12 months after initial sample collection...
Categories: Data;
Tags: Anoka County,
Becker County,
Beltrami County,
Carlton County,
Carver County,
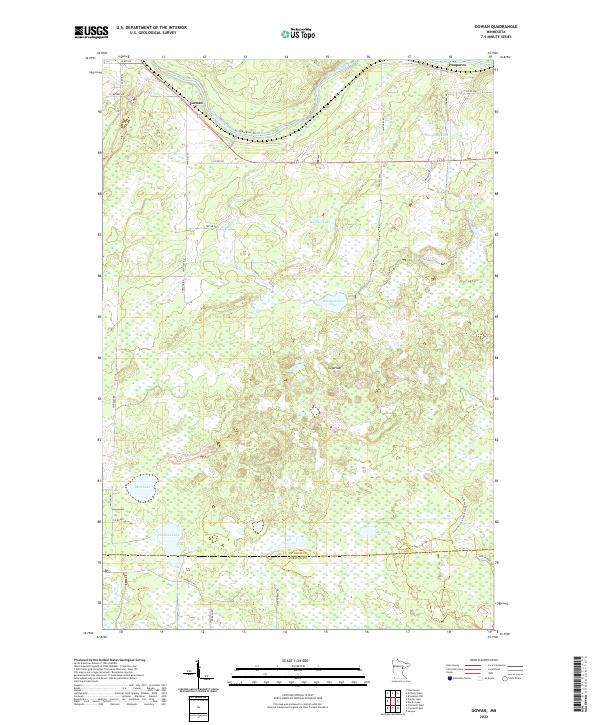
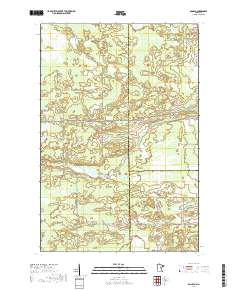
Layered geospatial PDF 7.5 Minute Quadrangle Map. Layers of geospatial data include orthoimagery, roads, grids, geographic names, elevation contours, hydrography, and other selected map features. This map is derived from GIS (geospatial information system) data. It represents a repackaging of GIS data in traditional map form, not creation of new information. The geospatial data in this map are from selected National Map data holdings and other government sources.

Layered geospatial PDF 7.5 Minute Quadrangle Map. Layers of geospatial data include orthoimagery, roads, grids, geographic names, elevation contours, hydrography, and other selected map features. This map is derived from GIS (geospatial information system) data. It represents a repackaging of GIS data in traditional map form, not creation of new information. The geospatial data in this map are from selected National Map data holdings and other government sources.
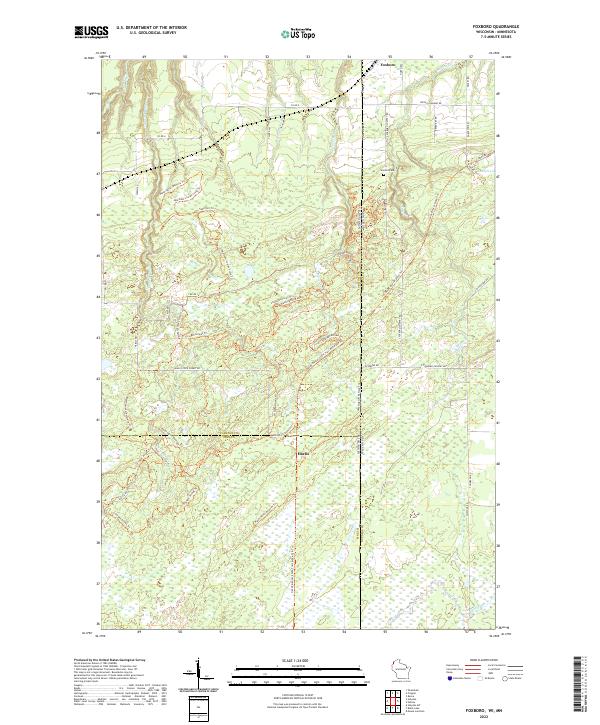
Layered geospatial PDF 7.5 Minute Quadrangle Map. Layers of geospatial data include orthoimagery, roads, grids, geographic names, elevation contours, hydrography, and other selected map features. This map is derived from GIS (geospatial information system) data. It represents a repackaging of GIS data in traditional map form, not creation of new information. The geospatial data in this map are from selected National Map data holdings and other government sources.
Layered geospatial PDF 7.5 Minute Quadrangle Map. Layers of geospatial data include orthoimagery, roads, grids, geographic names, elevation contours, hydrography, and other selected map features. This map is derived from GIS (geospatial information system) data. It represents a repackaging of GIS data in traditional map form, not creation of new information. The geospatial data in this map are from selected National Map data holdings and other government sources.
Layered geospatial PDF 7.5 Minute Quadrangle Map. Layers of geospatial data include orthoimagery, roads, grids, geographic names, elevation contours, hydrography, and other selected map features. This map is derived from GIS (geospatial information system) data. It represents a repackaging of GIS data in traditional map form, not creation of new information. The geospatial data in this map are from selected National Map data holdings and other government sources.
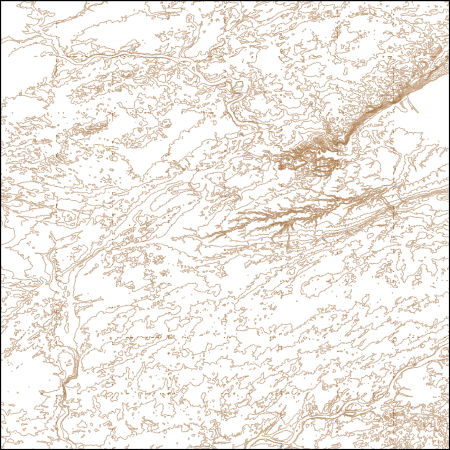
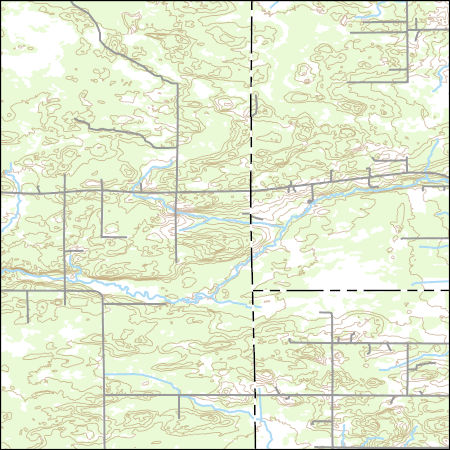
These vector contour lines are derived from the 3D Elevation Program using automated and semi-automated processes. They were created to support 1:24,000-scale CONUS and Hawaii, 1:25,000-scale Alaska, and 1:20,000-scale Puerto Rico / US Virgin Island topographic map products, but are also published in this GIS vector format. Contour intervals are assigned by 7.5-minute quadrangle, so this vector dataset is not visually seamless across quadrangle boundaries. The vector lines have elevation attributes (in feet above mean sea level on NAVD88), but this dataset does not carry line symbols or annotation.
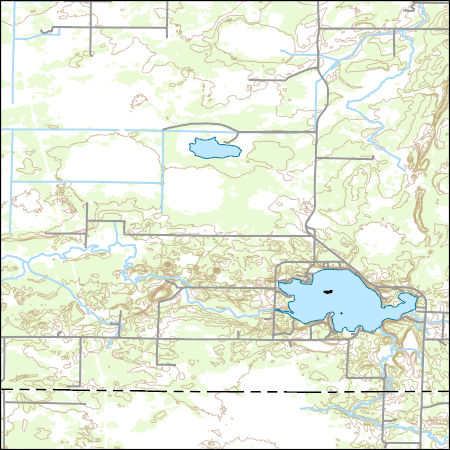
Layers of geospatial data include contours, boundaries, land cover, hydrography, roads, transportation, geographic names, structures, and other selected map features.
Types: Citation;
Tags: 7.5 x 7.5 minute,
7.5 x 7.5 minute,
Carlton County,
Combined Vector,
Combined Vector,
This data release provides total and aqueous arsenic (As) determinations and associated field readings collected from groundwater sampled from 254 newly constructed private residential wells between 2014 and 2016. The study focuses on three regions of Minnesota that differ geologically: south-central (herein called central), northwest, and northeast. These study regions were chosen due to their prevalent elevated As concentrations in drinking water. Each of the 254 wells were sampled in three rounds by the Minnesota Department of Health (MDH). The timing of the three sampling rounds was (1) immediately or shortly after well construction (round 1); (2) 3-6 months after initial sample collection (round 2); and (3)...
Categories: Data;
Types: Citation;
Tags: Anoka County,
Becker County,
Beltrami County,
Carlton County,
Carver County,
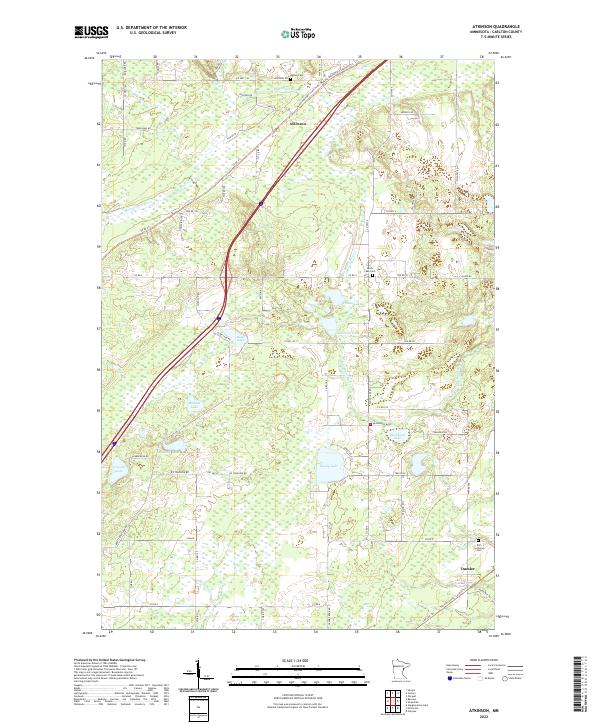
Layered geospatial PDF 7.5 Minute Quadrangle Map. Layers of geospatial data include orthoimagery, roads, grids, geographic names, elevation contours, hydrography, and other selected map features. This map is derived from GIS (geospatial information system) data. It represents a repackaging of GIS data in traditional map form, not creation of new information. The geospatial data in this map are from selected National Map data holdings and other government sources.
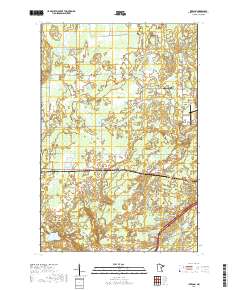
Layered geospatial PDF 7.5 Minute Quadrangle Map. Layers of geospatial data include orthoimagery, roads, grids, geographic names, elevation contours, hydrography, and other selected map features. This map is derived from GIS (geospatial information system) data. It represents a repackaging of GIS data in traditional map form, not creation of new information. The geospatial data in this map are from selected National Map data holdings and other government sources.
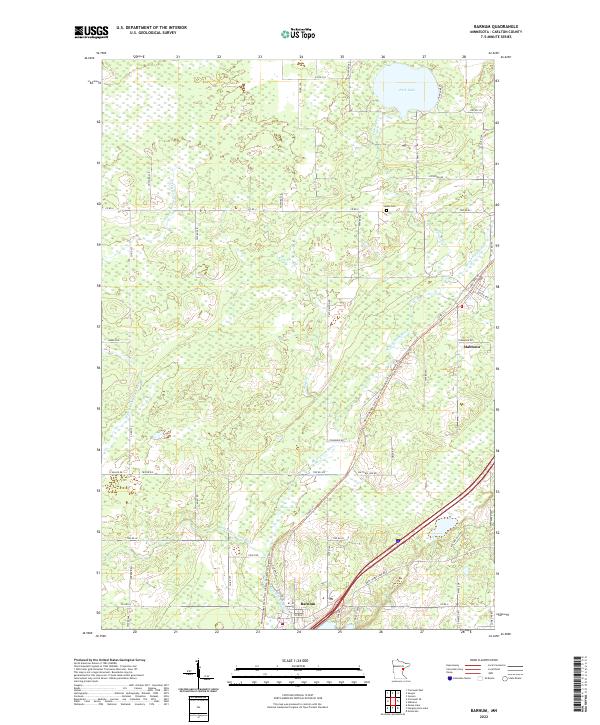
Layered geospatial PDF 7.5 Minute Quadrangle Map. Layers of geospatial data include orthoimagery, roads, grids, geographic names, elevation contours, hydrography, and other selected map features. This map is derived from GIS (geospatial information system) data. It represents a repackaging of GIS data in traditional map form, not creation of new information. The geospatial data in this map are from selected National Map data holdings and other government sources.
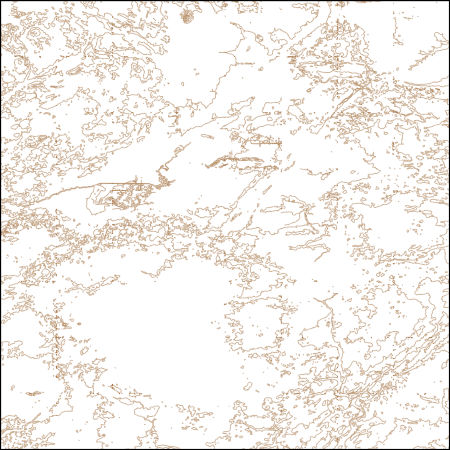
These vector contour lines are derived from the 3D Elevation Program using automated and semi-automated processes. They were created to support 1:24,000-scale CONUS and Hawaii, 1:25,000-scale Alaska, and 1:20,000-scale Puerto Rico / US Virgin Island topographic map products, but are also published in this GIS vector format. Contour intervals are assigned by 7.5-minute quadrangle, so this vector dataset is not visually seamless across quadrangle boundaries. The vector lines have elevation attributes (in feet above mean sea level on NAVD88), but this dataset does not carry line symbols or annotation.
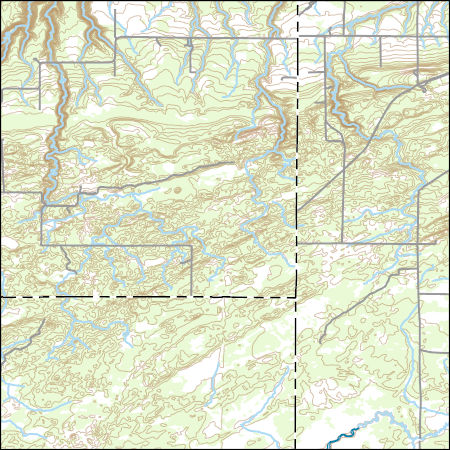
Layers of geospatial data include contours, boundaries, land cover, hydrography, roads, transportation, geographic names, structures, and other selected map features.
Types: Citation;
Tags: 7.5 x 7.5 minute,
7.5 x 7.5 minute,
Carlton County,
Combined Vector,
Combined Vector,
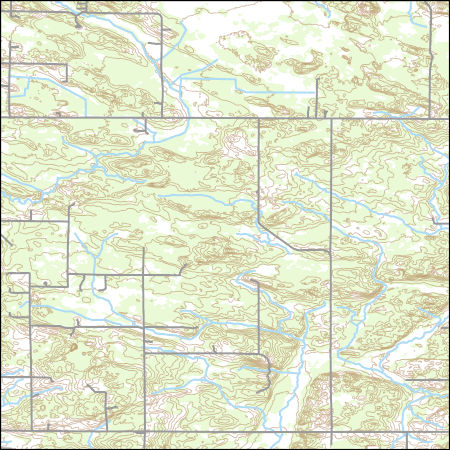
Layers of geospatial data include contours, boundaries, land cover, hydrography, roads, transportation, geographic names, structures, and other selected map features.
Types: Citation;
Tags: 7.5 x 7.5 minute,
7.5 x 7.5 minute,
Carlton County,
Combined Vector,
Combined Vector,
Layers of geospatial data include contours, boundaries, land cover, hydrography, roads, transportation, geographic names, structures, and other selected map features.
Types: Citation;
Tags: 7.5 x 7.5 minute,
7.5 x 7.5 minute,
Aitkin County,
Carlton County,
Combined Vector,
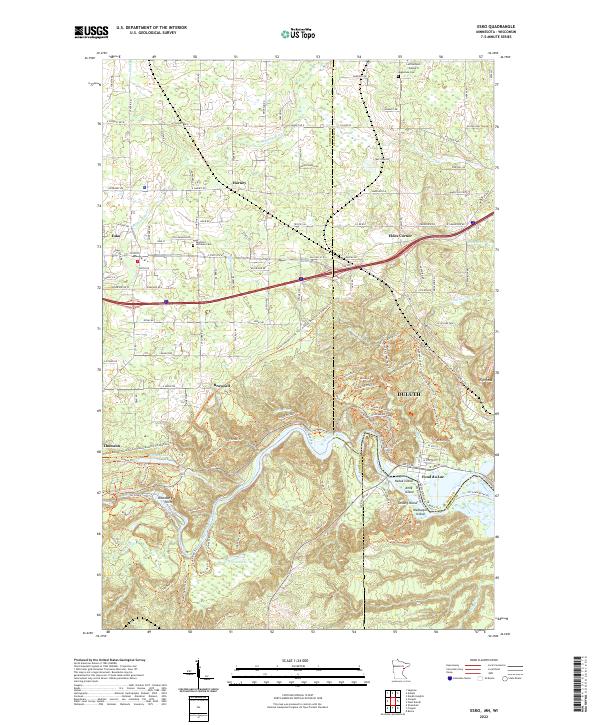
Layered geospatial PDF 7.5 Minute Quadrangle Map. Layers of geospatial data include orthoimagery, roads, grids, geographic names, elevation contours, hydrography, and other selected map features. This map is derived from GIS (geospatial information system) data. It represents a repackaging of GIS data in traditional map form, not creation of new information. The geospatial data in this map are from selected National Map data holdings and other government sources.
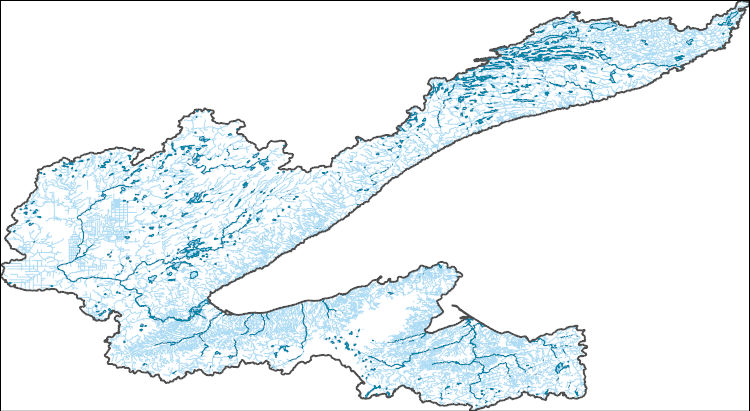
The High Resolution National Hydrography Dataset Plus (NHDPlus HR) is an integrated set of geospatial data layers, including the best available National Hydrography Dataset (NHD), the 10-meter 3D Elevation Program Digital Elevation Model (3DEP DEM), and the National Watershed Boundary Dataset (WBD). The NHDPlus HR combines the NHD, 3DEP DEMs, and WBD to create a stream network with linear referencing, feature naming, "value added attributes" (VAAs), elevation-derived catchments, and other features for hydrologic data analysis. The stream network with linear referencing is a system of data relationships applied to hydrographic systems so that one stream reach "flows" into another and "events" can be tied to and traced...
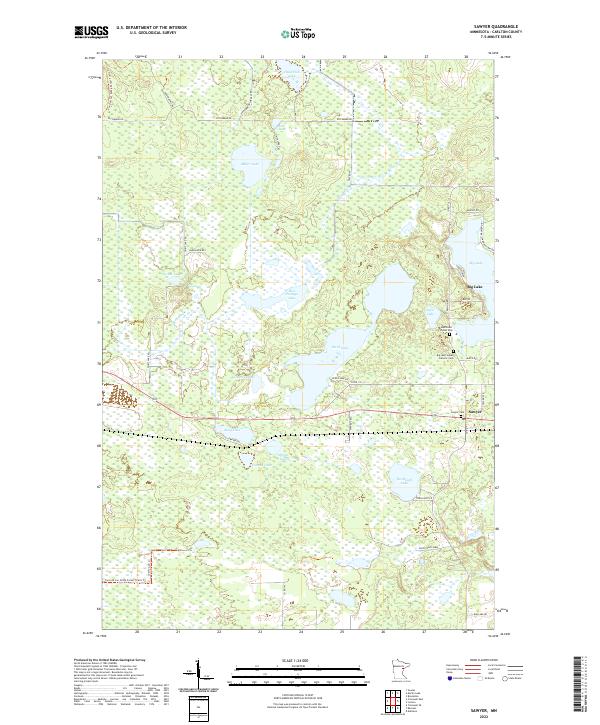
Layered geospatial PDF 7.5 Minute Quadrangle Map. Layers of geospatial data include orthoimagery, roads, grids, geographic names, elevation contours, hydrography, and other selected map features. This map is derived from GIS (geospatial information system) data. It represents a repackaging of GIS data in traditional map form, not creation of new information. The geospatial data in this map are from selected National Map data holdings and other government sources.
|

|
