Filters: Tags: Chinook Salmon (X)
38 results (10ms)|
Filters
|
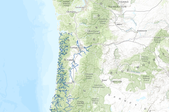
Region(s) of distribution of Chinook Salmon (Oncorhynchus tshawytscha) (Walbaum, 1792) in the Arctic as digitized for U.S. Geological Survey Scientific Investigations Report 2016-5038. For details on the project and purpose, see the report at https://doi.org/10.3133/sir20165038. Complete metadata for the collection of species datasets is in the metadata document "Dataset_for_Alaska_Marine_Fish_Ecology_Catalog.xml" at https://doi.org/10.5066/F7M61HD7. Source(s) for this digitized data layer are listed in the metadata Process Steps section. Note that the original source may show an extended area; some datasets were limited to the published map boundary. Distributions of marine fishes are shown in adjacent Arctic seas...
Categories: Data;
Types: Citation,
Downloadable,
Map Service,
OGC WFS Layer,
OGC WMS Layer,
Shapefile;
Tags: (Walbaum, 1792),
Alaska,
Arctic,
Arctic,
Beaufort Sea,

Derived from: Wild Salmon Center. 2008. Pacific Salmon Conservation Assessment: Vector digital data. Portland, OR: Wild Salmon Center. Depending on the data available for a catchment, ourabundance estimates came either directly from otherresearchersâ estimates of abundance or indirectly fromestimates of spawning adults, catch, harvest rates, ormultiple-regression equations we developed to predict abundance. This database, with citations, is available fromhttp://www.stanford.edu/?mpinsky/salmon/.We caution that our abundance estimates come frommany different sources in which a wide variety ofmethods were used, so they are rough approximationsrather than precise estimates. This is the nature ofdata available for...
Concerns regarding the size and sex composition of Yukon River Chinook salmon Oncorhynchus tshawytscha have been expressed in public meetings for over a decade. However, reports of small size and low numbers of females have become increasingly common in recent years, and apprehension over the long-term health of the stock has grown within the drainage. In response to these reports, the Salmon Size Subcommittee of the US/Canada Yukon River Joint Technical Committee was formed and charged with advising the Committee, and thereby the US/Canada Yukon River Panel, with respect to changes in Chinook salmon age, sex, and size composition. This report, which summarizes the findings of prior investigations and the scientific...
Yukon River Chinook salmon (Oncorhynchus tshawytscha) have been targeted in large-mesh gill net fisheries for over 100 years. Recent reductions in productivity and perceptions of reduced size and earlier age at maturation have elevated concerns regarding the potential consequences of the selective exploitation of large fish. Investigations associating changes in population productivity and demography, particularly size and age composition, with overharvest and selective exploitation are common in the fisheries literature. However, most such investigations have considered long-lived species repeatedly subject to exploitation, often prior to maturation. Similar investigations concerning semelparous Pacific salmon...
Categories: Publication;
Types: Citation;
Tags: Baseline 5-Data,
Chinook Salmon,
Species of Concern: Fish
Individual point estimates of stream density by juvenile salmonid species in two small tributaries to the Salmon River, Lake Ontario, New York were recorded. Enumeration of salmonid species was observed using a backpack electrofisher in order to identify fish species. Stream density estimates were calculated using stream width measurements taken at equally spaced transects. Comparisons of species densities between the two streams were analyzed to infer competition or segregation.
In 2005, the Department of Fisheries and Oceans (DFO) adopted Canada’s Policy for the Conservation of Wild Salmon Policy (the WSP) (DFO 2005). Implementation of the WSP consists of six strategies, the first of which requires the standardized monitoring of wild salmon status. Standardized monitoring begins with the identification of species-specific Conservation Units or CUs. The CUs serve two roles under the WSP. First, each CU is, in some sense, a significant element of biodiversity that the WSP seeks to conserve and manage. Second, each CU is a unit for reporting on the success (or failure) of actions taken under the WSP to conserve wild Pacific salmon. Subsequent steps in the Policy’s implementation, including...
Categories: Data;
Types: Downloadable,
Map Service,
OGC WFS Layer,
OGC WMS Layer,
Shapefile;
Tags: Anadromous Resources,
Chinook salmon,
Chum salmon,
Freshwater Resources,
NPLCC,
These data describe areas of suitable habitat believed to be used (currently and historically) by wild, natural, and/or hatchery fish populations. The term "currently" is defined as within the past five reproductive cycles. See the 'USETYPE' field description to differentiate between current and historic distribution. This information is based on extensive surveys, the best professional judgment of ODFW staff biologists and where possible, the professional opinions of staff from other natural resource agencies. Due to natural variations in run size, water conditions, or other environmental factors, some areas displayed may not be used by a species of fish on an annual basis. The Natural Resources Information Management...
Fifth Field Hydrologic Units (watersheds) polygons for the Chinook Salmon population and distribution within the Western Oregon Plan Revision (WOPR) area.BLM (Bureau of Land Management) WOPR (Western Oregon Plan Revision) PRMP (Proposed Resource Management Plan) WOPR Theme Group: FSH (Fish) WOPR Purpose: A (Analysis) HUC (Hydrologic Unit Code) CHART (Critical Habitat Analytical Review Team) This data is a PRMP release version of the data fsh_aa_a_chinookhuc5_chart_poly.
Categories: Data,
Publication;
Types: Citation,
Downloadable,
Map Service,
OGC WFS Layer,
OGC WMS Layer,
Shapefile;
Tags: Baseline 5-Data,
Baseline 5-Data,
Chinook Salmon,
Chum Salmon,
Fish,
Categories: Data,
Publication;
Types: Citation,
Downloadable,
Map Service,
OGC WFS Layer,
OGC WMS Layer,
Shapefile;
Tags: Baseline 5-Data,
Chinook Salmon,
Species of Concern: Fish

The geographic distribution of stream reaches with potential to support high quality habitat for salmonids has bearing on the actual status of habitats and populations over broad spatial extents. As part of the Coastal Landscape Analysis and Modeling Study (CLAMS), we examined how salmon-habitat potential was distributed relative to current and future (+100 years) landscape characteristics in the Coastal Province of Oregon, USA. The intrinsic potential to provide high-quality rearing habitat was modeled for juvenile coho salmon (Oncorhynchus kisutch) and juvenile steelhead (O. mykiss) based on stream flow, valley constraint, and stream gradient. See Supplemental Information for additional detail.<br /><br />BLM...
This investigation sought to characterize the shedding of infectious hematopoietic necrosis virus (IHNV) in two populations of Columbia River Basin (CRB) Chinook salmon (Oncorhynchus tshawytscha). Juvenile spring- and fall-run Chinook salmon were exposed by immersion to each of three IHN virus strains from the UC, MD, and L subgroups, and then monitored for viral shedding from individual fish for 30 days. Detectable quantities of UC, MD and L IHN virus were shed by a subset of fish from each host population (1–9 out of 10 fish total in each treatment group). Viral shedding kinetics were consistent, with a rapid onset of shedding, peak shedding by 2–3 days, and then a rapid decline to below detectable levels by 7...
Categories: Data;
Tags: Chinook salmon,
Columbia River Basin,
IHNV,
Pacific Northwest,
USGS Science Data Catalog (SDC),
Harvests of Yukon Chinook salmon increased in the mid-1970s, then declined during 1998 to 2007 in response to fewer returning salmon. We examined annual growth of age-1.3 and age-1.4 Yukon Chinook salmon scales, 1965-2004, and tested the hypothesis that shifts in Chinook salmon abundance were related to annual growth at sea. Annual scale growth trends were not significantly correlated with salmon abundance indices, sea surface temperature, or climate indices, although growth during the first year at sea appeared to have been affected by the 1977 and 1989 ocean regime shifts. Chinook salmon scale growth was dependent on growth during the previous year, a factor that may have confounded detection of relationships...
This dataset was created as a way to have standard fish distribution datasets across the various fish species for the study area. This was needed because the original source datasets for fish distributions came from several different sources and were at various scales and also overlapped. To fix the issues in the source datasets we walked the original data over to the NHD Plus hydrography. These data are provided by Bureau of Land Management (BLM) "as is" and may contain errors or omissions. The User assumes the entire risk associated with its use of these data and bears all responsibility in determining whether these data are fit for the User's intended use. The User is encouraged to carefully consider the content...
Great Lakes fishery managers and stakeholders have little information regarding how climate change could affect the management and conservation of fish populations, including those of high recreational and commercial value. USGS scientists worked closely with state management agencies and the National Wildlife Federation to complete several objectives that provide knowledge to aid their planning and management strategies in anticipation of coming changes. First, researchers updated a regional Great Lakes climate model to predict water level changes, water temperatures, and ice cover data for the entire Great Lakes basin 50-100 years into the future. Second, researchers used satellite data to determine whether the...
|

|
