Filters: Tags: Clackamas County (X) > Date Range: {"choice":"year"} (X)
24 results (103ms)|
Filters
Date Types (for Date Range)
Categories Tag Types Tag Schemes |
This data release provides access to a low-altitude aeromagnetic survey flown over a part of the Cascade Range of the US Pacific Northwest, approximately centered over the town of Cascade Locks, Oregon. The Cascade Locks magnetic survey encompasses two large stratovolcanoes of the Cascade Range: Mt. Hood (3426 m) in Oregon and Mt. Adams (3742 m) in Washington. Data were acquired between October 17, 2021, and February 26, 2022, by KBM Resources Group, Thunder Bay, Ontario, Canada, working under contract to the U.S. Geological Survey. The survey is underlain by a diverse magnetic terrane, including Miocene flood basalts of the Columbia River Basalt Group and Tertiary to Quaternary volcanic and intrusive rocks of the...
Categories: Data;
Tags: Cascade Range,
Cascadia,
Clackamas County,
Clark County,
Columbia River Gorge National Scenic Area,

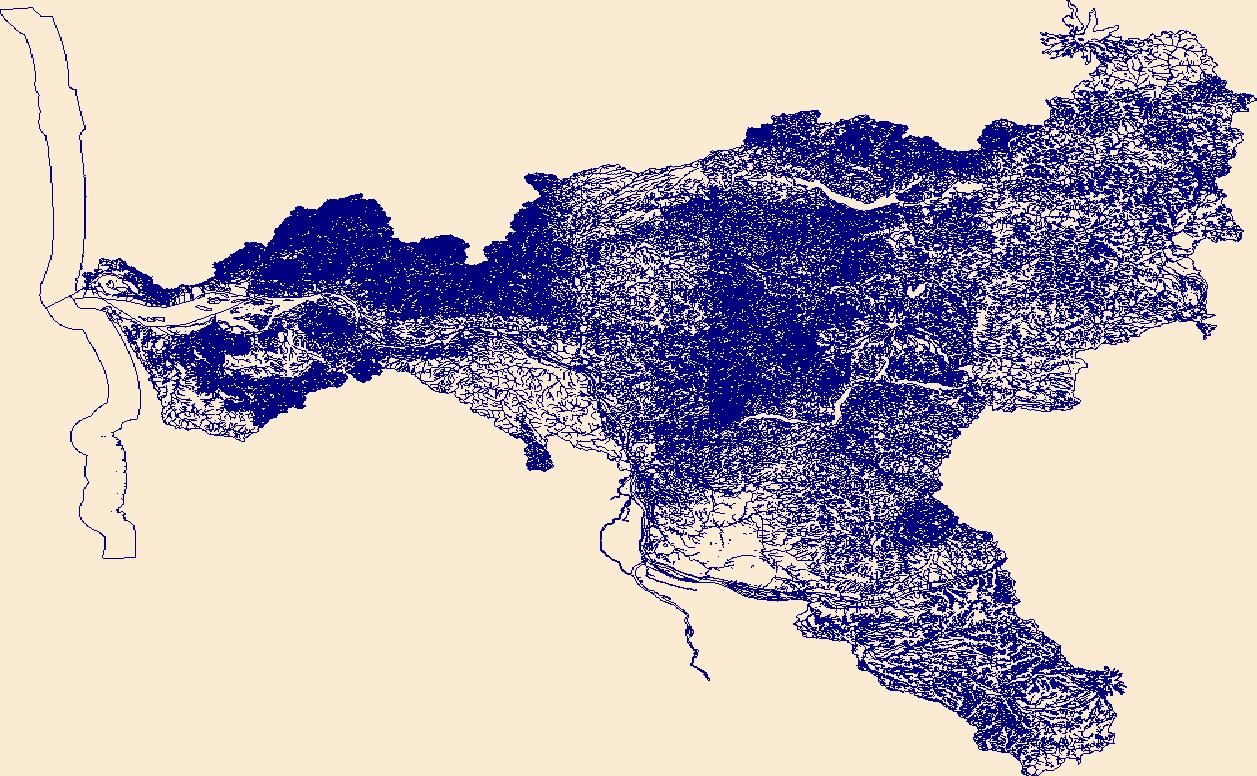
These data were released prior to the October 1, 2016 effective date for the USGS’s policy dictating the review, approval, and release of scientific data as referenced in USGS Survey Manual Chapter 502.8 Fundamental Science Practices: Review and Approval of Scientific Data for Release. Estuarine ecosystems are controlled by a variety of processes that operate at multiple spatial and temporal scales. Understanding the hierarchical nature of these processes will aid in prioritization of restoration efforts. This hierarchical Columbia River Estuary Ecosystem Classification (henceforth "Classification") of the Columbia River estuary is a spatial database of the tidally-influenced reaches of the lower Columbia River,...

These data were released prior to the October 1, 2016 effective date for the USGS’s policy dictating the review, approval, and release of scientific data as referenced in USGS Survey Manual Chapter 502.8 Fundamental Science Practices: Review and Approval of Scientific Data for Release. Estuarine ecosystems are controlled by a variety of processes that operate at multiple spatial and temporal scales. Understanding the hierarchical nature of these processes will aid in prioritization of restoration efforts. This hierarchical Columbia River Estuary Ecosystem Classification (henceforth "Classification") of the Columbia River estuary is a spatial database of the tidally-influenced reaches of the lower Columbia River,...
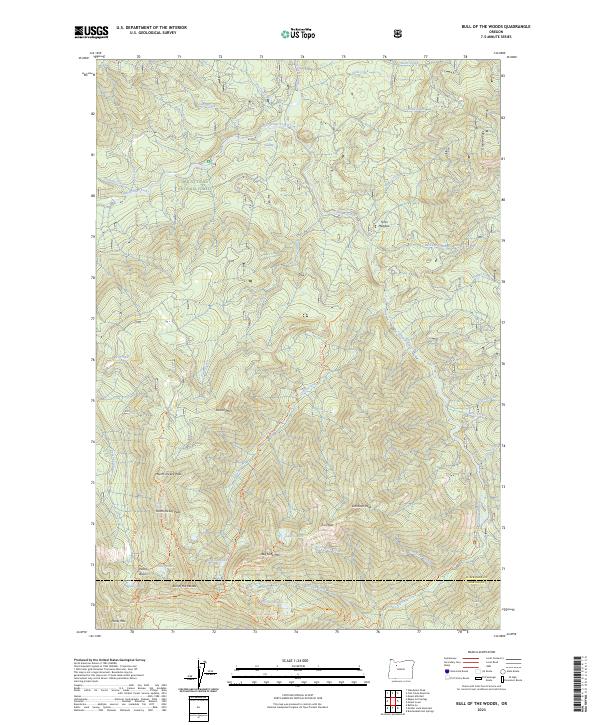
Layered geospatial PDF 7.5 Minute Quadrangle Map. Layers of geospatial data include orthoimagery, roads, grids, geographic names, elevation contours, hydrography, and other selected map features. This map is derived from GIS (geospatial information system) data. It represents a repackaging of GIS data in traditional map form, not creation of new information. The geospatial data in this map are from selected National Map data holdings and other government sources.

These data were released prior to the October 1, 2016 effective date for the USGS’s policy dictating the review, approval, and release of scientific data as referenced in USGS Survey Manual Chapter 502.8 Fundamental Science Practices: Review and Approval of Scientific Data for Release. Estuarine ecosystems are controlled by a variety of processes that operate at multiple spatial and temporal scales. Understanding the hierarchical nature of these processes will aid in prioritization of restoration efforts. This hierarchical Columbia River Estuary Ecosystem Classification (henceforth "Classification") of the Columbia River estuary is a spatial database of the tidally-influenced reaches of the lower Columbia River,...
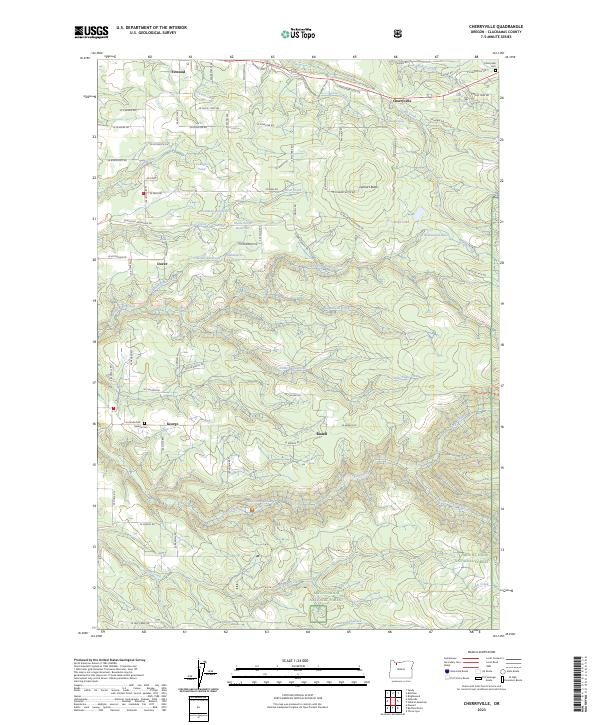
Layered geospatial PDF 7.5 Minute Quadrangle Map. Layers of geospatial data include orthoimagery, roads, grids, geographic names, elevation contours, hydrography, and other selected map features. This map is derived from GIS (geospatial information system) data. It represents a repackaging of GIS data in traditional map form, not creation of new information. The geospatial data in this map are from selected National Map data holdings and other government sources.
Layered geospatial PDF 7.5 Minute Quadrangle Map. Layers of geospatial data include orthoimagery, roads, grids, geographic names, elevation contours, hydrography, and other selected map features. This map is derived from GIS (geospatial information system) data. It represents a repackaging of GIS data in traditional map form, not creation of new information. The geospatial data in this map are from selected National Map data holdings and other government sources.
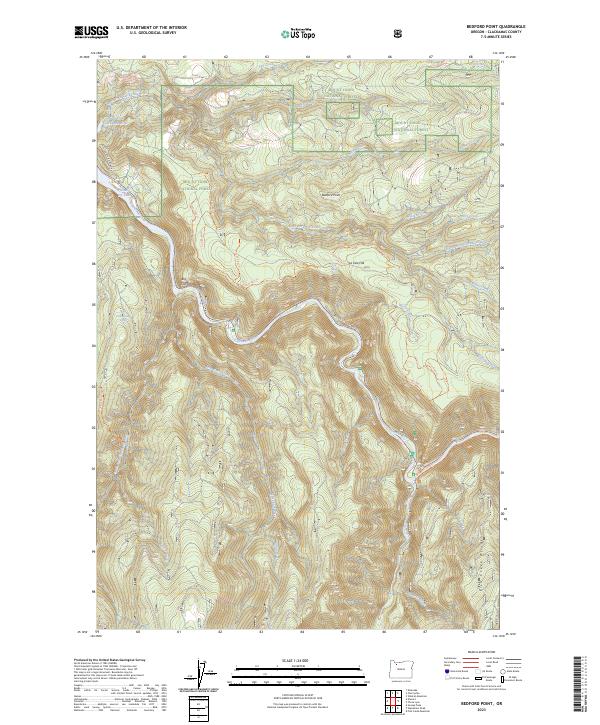
Layered geospatial PDF 7.5 Minute Quadrangle Map. Layers of geospatial data include orthoimagery, roads, grids, geographic names, elevation contours, hydrography, and other selected map features. This map is derived from GIS (geospatial information system) data. It represents a repackaging of GIS data in traditional map form, not creation of new information. The geospatial data in this map are from selected National Map data holdings and other government sources.
Layered geospatial PDF 7.5 Minute Quadrangle Map. Layers of geospatial data include orthoimagery, roads, grids, geographic names, elevation contours, hydrography, and other selected map features. This map is derived from GIS (geospatial information system) data. It represents a repackaging of GIS data in traditional map form, not creation of new information. The geospatial data in this map are from selected National Map data holdings and other government sources.
Layered geospatial PDF 7.5 Minute Quadrangle Map. Layers of geospatial data include orthoimagery, roads, grids, geographic names, elevation contours, hydrography, and other selected map features. This map is derived from GIS (geospatial information system) data. It represents a repackaging of GIS data in traditional map form, not creation of new information. The geospatial data in this map are from selected National Map data holdings and other government sources.
Layered geospatial PDF 7.5 Minute Quadrangle Map. Layers of geospatial data include orthoimagery, roads, grids, geographic names, elevation contours, hydrography, and other selected map features. This map is derived from GIS (geospatial information system) data. It represents a repackaging of GIS data in traditional map form, not creation of new information. The geospatial data in this map are from selected National Map data holdings and other government sources.
The High Resolution National Hydrography Dataset Plus (NHDPlus HR) is an integrated set of geospatial data layers, including the best available National Hydrography Dataset (NHD), the 10-meter 3D Elevation Program Digital Elevation Model (3DEP DEM), and the National Watershed Boundary Dataset (WBD). The NHDPlus HR combines the NHD, 3DEP DEMs, and WBD to create a stream network with linear referencing, feature naming, "value added attributes" (VAAs), elevation-derived catchments, and other features for hydrologic data analysis. The stream network with linear referencing is a system of data relationships applied to hydrographic systems so that one stream reach "flows" into another and "events" can be tied to and traced...
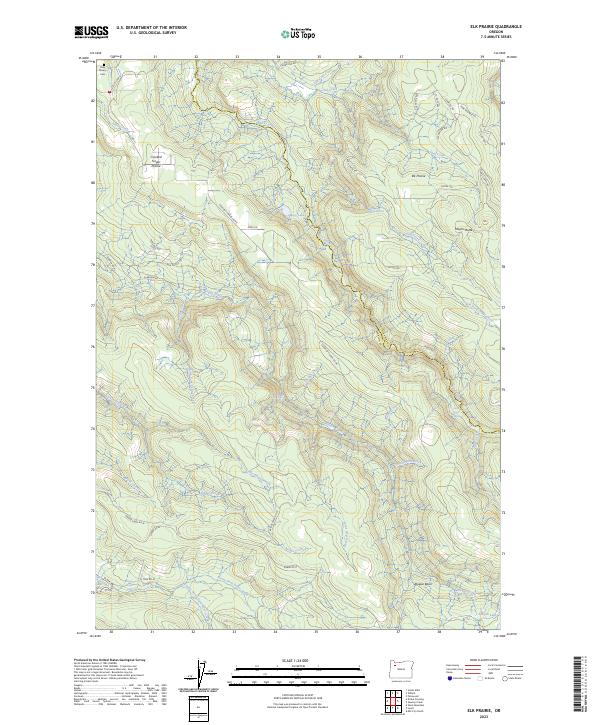
Layered geospatial PDF 7.5 Minute Quadrangle Map. Layers of geospatial data include orthoimagery, roads, grids, geographic names, elevation contours, hydrography, and other selected map features. This map is derived from GIS (geospatial information system) data. It represents a repackaging of GIS data in traditional map form, not creation of new information. The geospatial data in this map are from selected National Map data holdings and other government sources.

These data were released prior to the October 1, 2016 effective date for the USGS’s policy dictating the review, approval, and release of scientific data as referenced in USGS Survey Manual Chapter 502.8 Fundamental Science Practices: Review and Approval of Scientific Data for Release. Estuarine ecosystems are controlled by a variety of processes that operate at multiple spatial and temporal scales. Understanding the hierarchical nature of these processes will aid in prioritization of restoration efforts. This hierarchical Columbia River Estuary Ecosystem Classification (henceforth "Classification") of the Columbia River estuary is a spatial database of the tidally-influenced reaches of the lower Columbia River,...
Categories: pre-SM502.8;
Tags: Clackamas County,
Clark County,
Clatsop County,
Columbia County,
Columbia River,
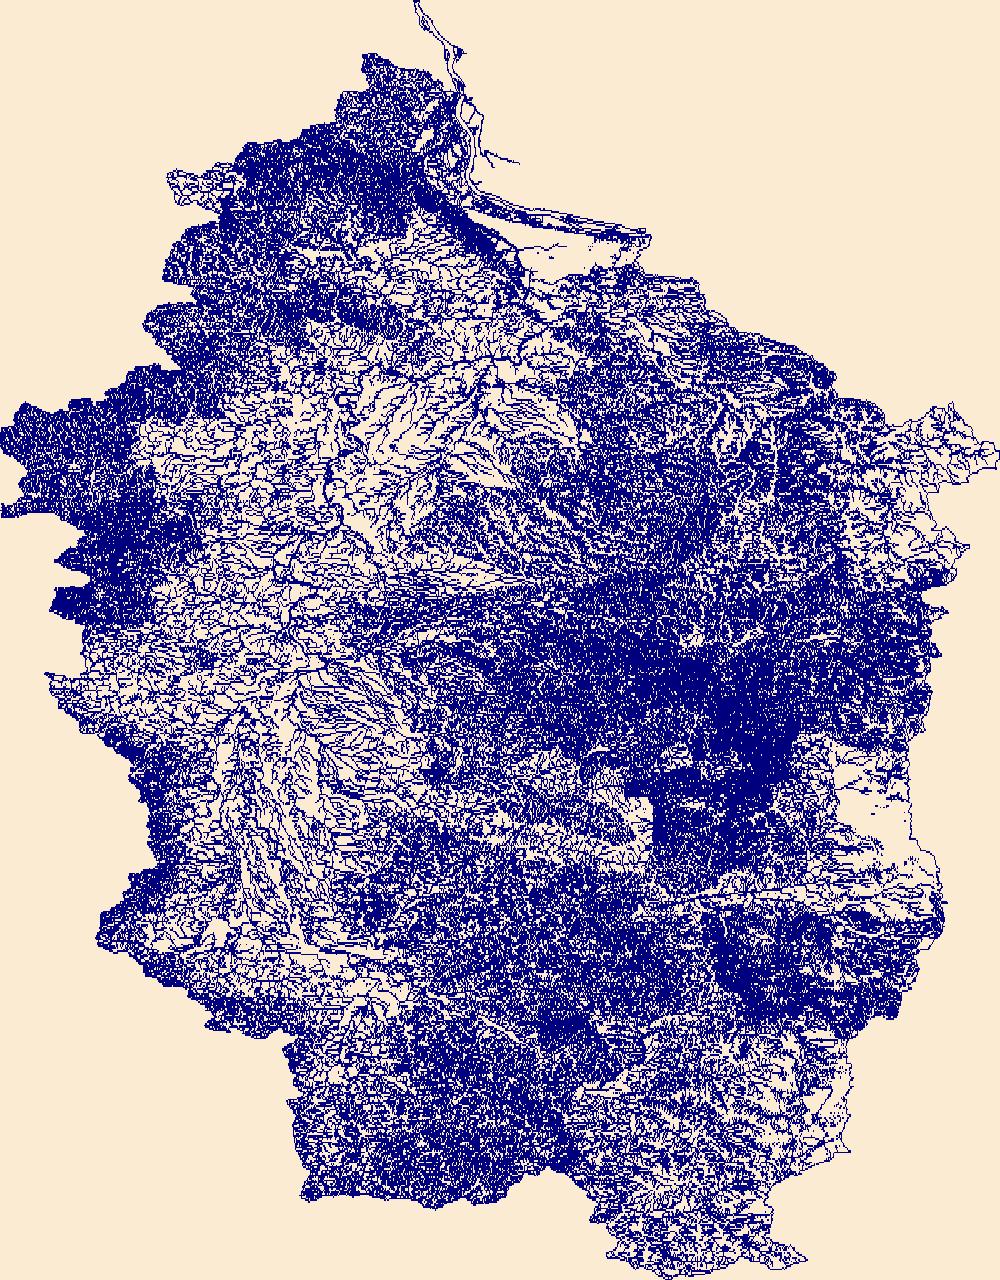
The High Resolution National Hydrography Dataset Plus (NHDPlus HR) is an integrated set of geospatial data layers, including the best available National Hydrography Dataset (NHD), the 10-meter 3D Elevation Program Digital Elevation Model (3DEP DEM), and the National Watershed Boundary Dataset (WBD). The NHDPlus HR combines the NHD, 3DEP DEMs, and WBD to create a stream network with linear referencing, feature naming, "value added attributes" (VAAs), elevation-derived catchments, and other features for hydrologic data analysis. The stream network with linear referencing is a system of data relationships applied to hydrographic systems so that one stream reach "flows" into another and "events" can be tied to and traced...
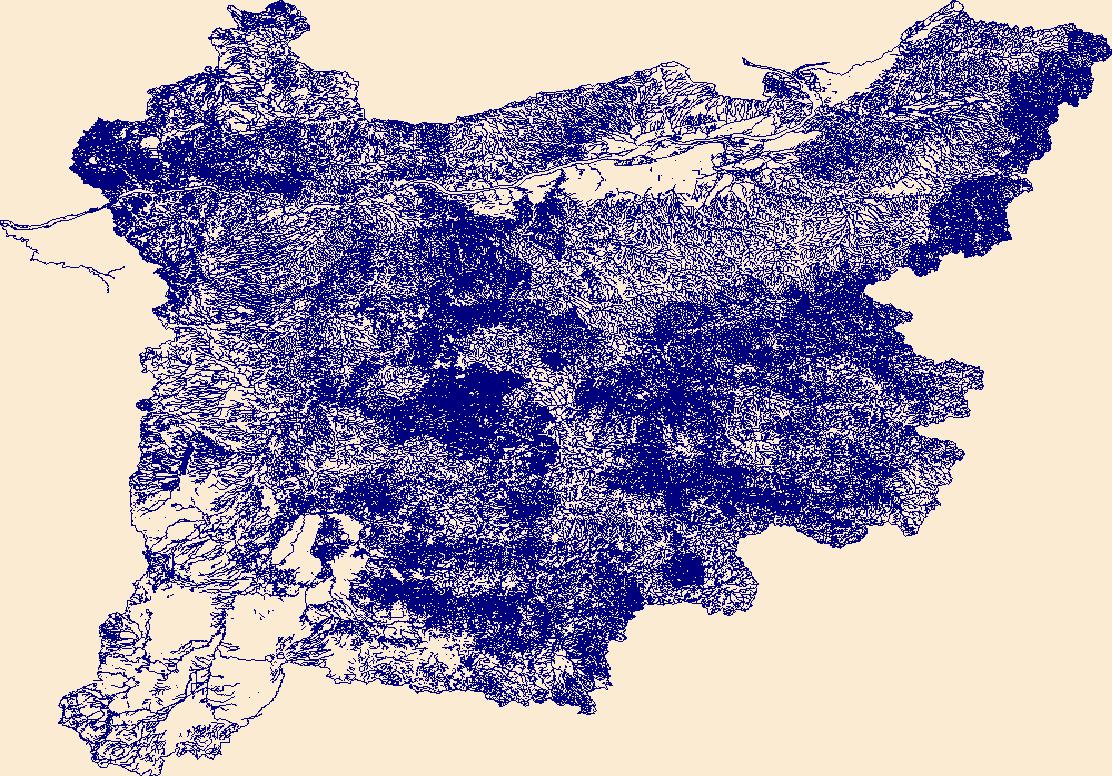
The High Resolution National Hydrography Dataset Plus (NHDPlus HR) is an integrated set of geospatial data layers, including the best available National Hydrography Dataset (NHD), the 10-meter 3D Elevation Program Digital Elevation Model (3DEP DEM), and the National Watershed Boundary Dataset (WBD). The NHDPlus HR combines the NHD, 3DEP DEMs, and WBD to create a stream network with linear referencing, feature naming, "value added attributes" (VAAs), elevation-derived catchments, and other features for hydrologic data analysis. The stream network with linear referencing is a system of data relationships applied to hydrographic systems so that one stream reach "flows" into another and "events" can be tied to and traced...
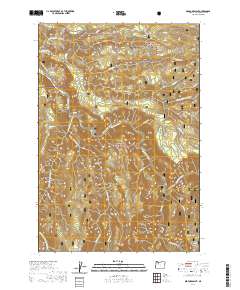
Layered geospatial PDF 7.5 Minute Quadrangle Map. Layers of geospatial data include orthoimagery, roads, grids, geographic names, elevation contours, hydrography, and other selected map features. This map is derived from GIS (geospatial information system) data. It represents a repackaging of GIS data in traditional map form, not creation of new information. The geospatial data in this map are from selected National Map data holdings and other government sources.
In the Willamette River Basin in northwestern Oregon, stream temperature has been altered by 13 dams operated by the U.S. Army Corps of Engineers (USACE), negatively influencing threatened populations of native salmonids. CE-QUAL-W2, a two-dimensional, hydrodynamic water quality model, has been used to investigate temperature and heat patterns in the Willamette River and the downstream effects of dam operations and other anthropogenic effects on heat and stream temperature. This data release includes the input and output files for six CE-QUAL-W2 models that include Fall Creek downstream of Fall Creek Dam, the Row River downstream of Dorena Dam, the Coast Fork Willamette River downstream of Cottage Grove Dam, the...
Categories: Data Release - Revised;
Tags: Benton County,
CE-QUAL-W2 model,
Clackamas County,
Coast Fork Willamette River,
Fall Creek,
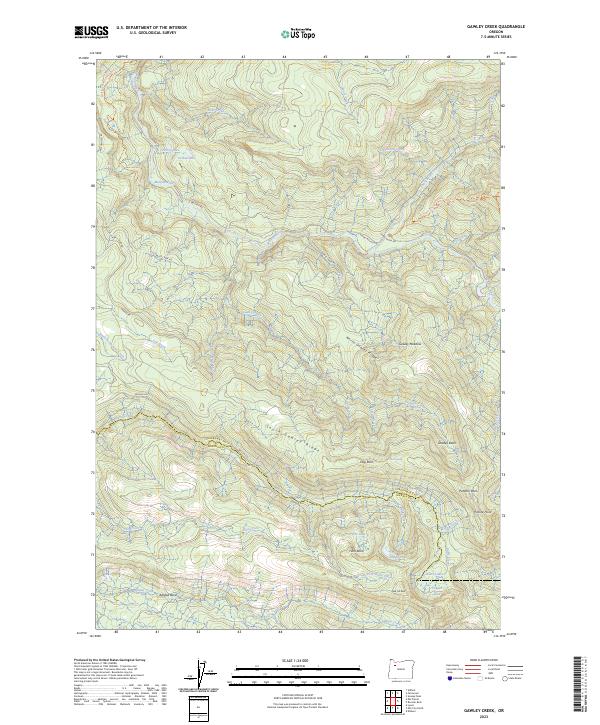
Layered geospatial PDF 7.5 Minute Quadrangle Map. Layers of geospatial data include orthoimagery, roads, grids, geographic names, elevation contours, hydrography, and other selected map features. This map is derived from GIS (geospatial information system) data. It represents a repackaging of GIS data in traditional map form, not creation of new information. The geospatial data in this map are from selected National Map data holdings and other government sources.
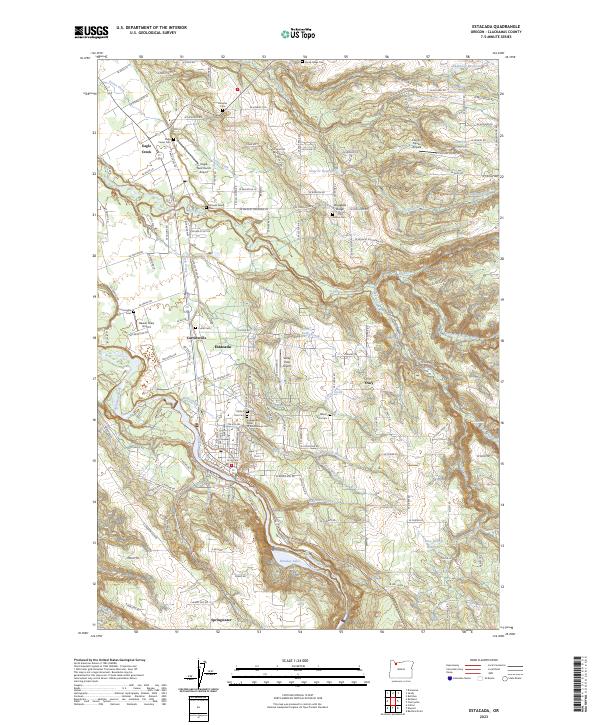
Layered geospatial PDF 7.5 Minute Quadrangle Map. Layers of geospatial data include orthoimagery, roads, grids, geographic names, elevation contours, hydrography, and other selected map features. This map is derived from GIS (geospatial information system) data. It represents a repackaging of GIS data in traditional map form, not creation of new information. The geospatial data in this map are from selected National Map data holdings and other government sources.
|

|
