Filters: Tags: Colleton County (X)
113 results (18ms)|
Filters
Date Range
Extensions (Less) Types (Less)
Contacts (Less)
Categories (Less) Tag Types Tag Schemes
|
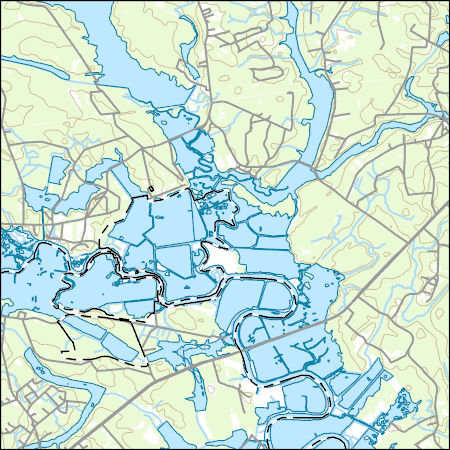
Layers of geospatial data include contours, boundaries, land cover, hydrography, roads, transportation, geographic names, structures, and other selected map features.
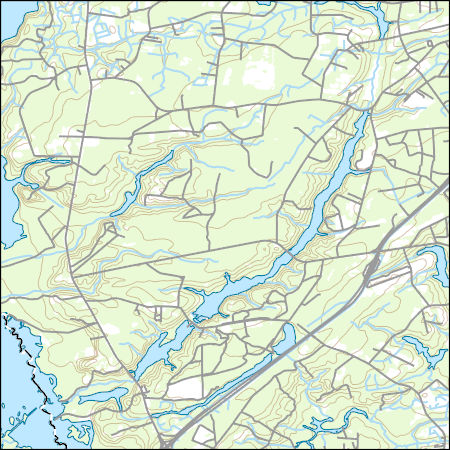
These vector contour lines are derived from the 3D Elevation Program using automated and semi-automated processes. They were created to support 1:24,000-scale CONUS and Hawaii, 1:25,000-scale Alaska, and 1:20,000-scale Puerto Rico / US Virgin Island topographic map products, but are also published in this GIS vector format. Contour intervals are assigned by 7.5-minute quadrangle, so this vector dataset is not visually seamless across quadrangle boundaries. The vector lines have elevation attributes (in feet above mean sea level on NAVD88), but this dataset does not carry line symbols or annotation.

Layers of geospatial data include contours, boundaries, land cover, hydrography, roads, transportation, geographic names, structures, and other selected map features.
Layers of geospatial data include contours, boundaries, land cover, hydrography, roads, transportation, geographic names, structures, and other selected map features.
These vector contour lines are derived from the 3D Elevation Program using automated and semi-automated processes. They were created to support 1:24,000-scale CONUS and Hawaii, 1:25,000-scale Alaska, and 1:20,000-scale Puerto Rico / US Virgin Island topographic map products, but are also published in this GIS vector format. Contour intervals are assigned by 7.5-minute quadrangle, so this vector dataset is not visually seamless across quadrangle boundaries. The vector lines have elevation attributes (in feet above mean sea level on NAVD88), but this dataset does not carry line symbols or annotation.
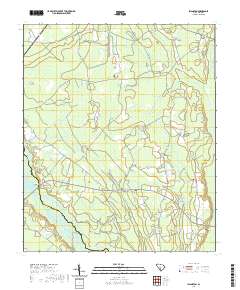
Layered geospatial PDF 7.5 Minute Quadrangle Map. Layers of geospatial data include orthoimagery, roads, grids, geographic names, elevation contours, hydrography, and other selected map features. This map is derived from GIS (geospatial information system) data. It represents a repackaging of GIS data in traditional map form, not creation of new information. The geospatial data in this map are from selected National Map data holdings and other government sources.
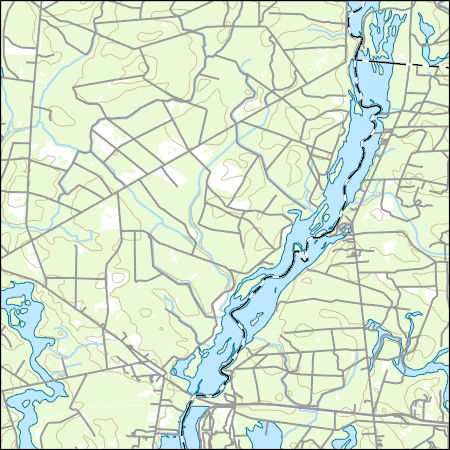
Layers of geospatial data include contours, boundaries, land cover, hydrography, roads, transportation, geographic names, structures, and other selected map features.
Layers of geospatial data include contours, boundaries, land cover, hydrography, roads, transportation, geographic names, structures, and other selected map features.
Layers of geospatial data include contours, boundaries, land cover, hydrography, roads, transportation, geographic names, structures, and other selected map features.
Layers of geospatial data include contours, boundaries, land cover, hydrography, roads, transportation, geographic names, structures, and other selected map features.
Layers of geospatial data include contours, boundaries, land cover, hydrography, roads, transportation, geographic names, structures, and other selected map features.
Layered geospatial PDF 7.5 Minute Quadrangle Map. Layers of geospatial data include orthoimagery, roads, grids, geographic names, elevation contours, hydrography, and other selected map features. This map is derived from GIS (geospatial information system) data. It represents a repackaging of GIS data in traditional map form, not creation of new information. The geospatial data in this map are from selected National Map data holdings and other government sources.
This database portrays the surface and shallow subsurface geology of the greater Charleston, S.C. region east of 80°30′ west and south of 33°15′ north. The region covers the entirety of Charleston County and portions of Berkeley, Colleton, Dorchester, and Georgetown Counties. Units locally exposed at the surface range in age from middle Eocene to Holocene, but most of the area is covered by Quaternary interglacial deposits. These are, from oldest to youngest, the Okefenokee, Waccamaw(?), Penholoway, Ladson, Ten Mile Hill, and Wando Formations and the Silver Bluff beds. Two cross sections (not included in the database), one running southeast from Harleyville to the coastline on James Island and the other running...

Layers of geospatial data include contours, boundaries, land cover, hydrography, roads, transportation, geographic names, structures, and other selected map features.
Layers of geospatial data include contours, boundaries, land cover, hydrography, roads, transportation, geographic names, structures, and other selected map features.
Airborne magnetic gradiometry data are provided here as part of the data release, "Airborne magnetic and radiometric survey, Charleston, South Carolina and surrounds, 2019." This data release includes the processed aeromagnetic horizontal gradiometry flight line data provided in an ascii .csv file and a geoTIFF image showing the magnetic intensity in nanoTeslas (nT). The contractor report and deliverables package are available on the parent page, https://doi.org/10.5066/P9EWQ08L. These data were collected as part of a high-resolution airborne magnetic and radiometric survey over Charleston, South Carolina and the surrounding region with a goal of better understanding earthquake hazards in the Charleston seismic...
Categories: Data;
Types: Downloadable,
GeoTIFF,
Map Service,
Raster;
Tags: Berkeley County,
Charleston,
Charleston County,
Clarendon County,
Colleton County,
Layered geospatial PDF 7.5 Minute Quadrangle Map. Layers of geospatial data include orthoimagery, roads, grids, geographic names, elevation contours, hydrography, and other selected map features. This map is derived from GIS (geospatial information system) data. It represents a repackaging of GIS data in traditional map form, not creation of new information. The geospatial data in this map are from selected National Map data holdings and other government sources.
This data release provides digital flight line data for a high-resolution airborne magnetic and radiometric survey over Charleston, South Carolina and the surrounding region. These data were collected to better understand earthquake hazards in the Charleston seismic zone by imaging structural features in the crystalline basement and to image heavy mineral sands containing titanium, zirconium, and rare earth elements using radiometric data (gamma spectrometry), which is sensitive to thorium in monazite. This survey represents a collaborative effort by the U.S. Geological Survey (USGS) Earthquake Hazards Program, Mineral Resources Program, National Cooperative Mapping Program, and Earth Mapping Resource Initiative...
Categories: Data;
Types: Downloadable,
Map Service,
OGC WFS Layer,
OGC WMS Layer,
Shapefile;
Tags: Berkeley County,
Charleston,
Charleston County,
Clarendon County,
Colleton County,
Layered geospatial PDF 7.5 Minute Quadrangle Map. Layers of geospatial data include orthoimagery, roads, grids, geographic names, elevation contours, hydrography, and other selected map features. This map is derived from GIS (geospatial information system) data. It represents a repackaging of GIS data in traditional map form, not creation of new information. The geospatial data in this map are from selected National Map data holdings and other government sources.
Layered geospatial PDF 7.5 Minute Quadrangle Map. Layers of geospatial data include orthoimagery, roads, grids, geographic names, elevation contours, hydrography, and other selected map features. This map is derived from GIS (geospatial information system) data. It represents a repackaging of GIS data in traditional map form, not creation of new information. The geospatial data in this map are from selected National Map data holdings and other government sources.
|

|
