Filters: Tags: Conterminous United States (X)
608 results (1s)|
Filters
Date Range
Extensions
Types Contacts
Categories Tag Types
|
This dataset represents one of three derived outlets or "pour points" for each 12-digit hydrologic unit (HU12) in the Watershed Boundary Dataset (WBD) snapshot delivered with NHDPlus V2.1. The three related pour point locations, each delivered in a stand-alone dataset, are: "from" (fpp) and "to" (tpp) points that identify the location where flow leaves the HU12 polygon based on a flow direction raster, and a third "vector pour point" (vpp) selected "upstream" used to identify flow confluences near the "from" and "to" pour point locations. The points are derived from the NHDPlus V2.1 flow direction rasters and the WBD snapshot delivered with NHDPlus V2.1. This metadata document describes the "from" pourpoints (fpp).
Categories: Data;
Types: Downloadable,
Map Service,
OGC WFS Layer,
OGC WMS Layer,
Shapefile;
Tags: Conterminous United States,
Hydrologic Unit,
NHDPlus V2.1,
National Hydrography Dataset Plus version 2.1,
Outlet point,
Using a combination of tabular and spatial data queries, we identified 129,773 flowlines in the hydrological framework of the National Hydrography Dataset Plus Version 1 (NHDPlusV1) that were created due to breaks in flowlines resulting from flowline intersection with quadrangle map boundaries. We found instances of this occurring in all 18 processing units of the NHDPlusV1 dataset. To aid in managing for this characteristic of the NHDPlus, we developed this EcoReach table (nhdplusv1_ecoreachv2.0.csv) that assigns all flowlines into units that are representative of ecological stream reaches. These "ecological stream reaches" may be defined by: stream origins, stream confluences, lake or reservoir inflows or outflows,...
LANDFIRE’s (LF) Annual Disturbance products provide temporal and spatial information related to landscape change. Annual Disturbance depicts areas of 4.5 hectares (11 acres) or larger that have experienced a natural or anthropogenic landscape change (or treatment) within a given year. For the creation of the Annual Disturbance product, information sources include national fire mapping programs such as Monitoring Trends in Burn Severity (MTBS), Burned Area Reflectance Classification (BARC) and Rapid Assessment of Vegetation Condition after Wildfire (RAVG), 18 types of agency-contributed "event" perimeters (see LF Public Events Geodatabase), and remotely sensed Landsat imagery. To create the LF Annual Disturbance...
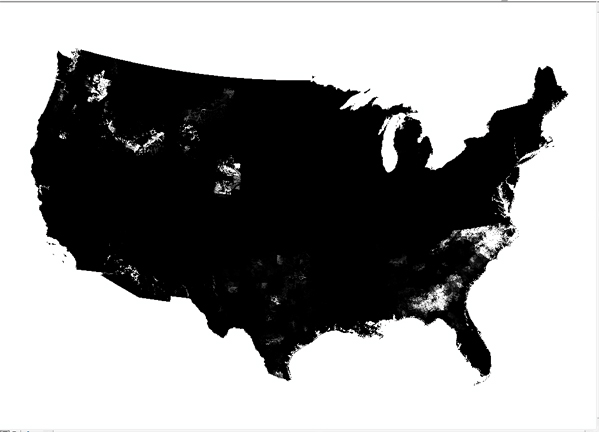
Members from the U.S. Geological Survey (USGS) Patterns in the Landscape - Analyses of Cause and Effect (PLACE) team are releasing monthly surface water maps for the conterminous United States (U.S.) from 2003 through 2019 as 250-meter resolution geoTIFF files. The maps were produced using the Dynamic Surface Water Extent (DSWE) algorithm applied to daily Moderate Resolution Imaging Spectroradiometer (MODIS) imagery (DSWEmod) (Soulard et al., 2021) - see associated items. The DSWEmod model classifies the landscape (i.e., each MODIS pixel) into different classes of surface water based on quantified levels of confidence, including, i) high-confidence surface water (class 1), ii) moderate-confidence surface water (class...
Members from the U.S. Geological Survey (USGS) Patterns in the Landscape - Analyses of Cause and Effect (PLACE) team are releasing monthly surface water maps for the conterminous United States (U.S.) from 2003 through 2019 as 250-meter resolution geoTIFF files. The maps were produced using the Dynamic Surface Water Extent (DSWE) algorithm applied to daily Moderate Resolution Imaging Spectroradiometer (MODIS) imagery (DSWEmod) (Soulard et al., 2021) - see associated items. The DSWEmod model classifies the landscape (i.e., each MODIS pixel) into different classes of surface water based on quantified levels of confidence, including, i) high-confidence surface water (class 1), ii) moderate-confidence surface water (class...
This tabular data set represents the percent of land cover classes from the 2006 National Land Cover Dataset compiled for two spatial components of the NHDPlus version 2 data suite (NHDPlusv2) for the conterminous United States; 1) individual reach catchments and 2) reach catchments accumulated upstream through the river network. This dataset can be linked to the NHDPlus version 2 data suite by the unique identifier COMID. The source data is the "National Land Cover Database 2006" produced by the United States Geological Survey (Fry and others, 2011). Units are percent. The "National Land Cover Database 2006" (NLCD 2006) is a 16-class (additional four classes in Alaska only) land cover classification scheme that...
This metadata record describes three best management practice scenarios for Nitrogen, Phosphorous, and Sediment based on information from the National Resource Conservation Service. The potential benefits of agricultural management practices were developed by USDA using estimates of nutrient and sediment reductions from agricultural fields due to the implementation of a suite of Best Management Practices (BMP's) (USDA, 2012). Estimates of losses were developed by the USDA Conservation Effects Assessment Program (CEAP) using a sampling and modeling approach. Data collected by the National Resources Inventory (NRI) Program were utilized to characterize representative agricultural areas for features such as soils,...
This tabular data set represents percent of irrigated agriculture, based on 2007 MODIS Irrigated Agricultural Data (MIrAD) data compiled for two spatial components of the NHDPlus version 2 data suite (NHDPlusv2) for the conterminous United States; 1) individual reach catchments and 2) reach catchments accumulated upstream through the river network. This dataset can be linked to the NHDPlus version 2 data suite by the unique identifier COMID. The source data for percent of irrigated agriculture, 2007 MIrAD data was produced by the United States Geological Survey (USGS, 2015). Units are percent. Reach catchment information characterizes data at the local scale. Reach catchments accumulated upstream through the river...
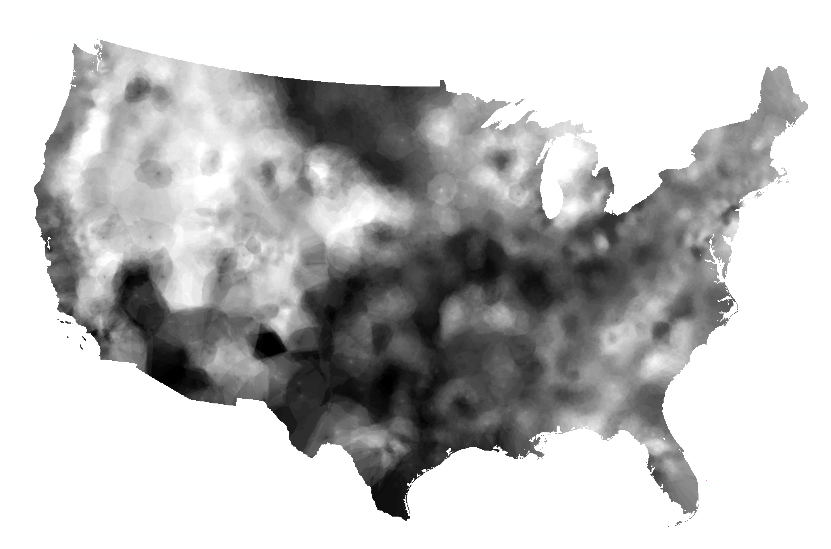
This 1-kilometer raster (grid) dataset for the conterminous United States was created by interpolating base-flow index (BFI) values estimated at U.S. Geological Survey (USGS) streamgages. Base flow is the component of streamflow that can be attributed to ground-water discharge into streams.
This spatial dataset consists of 199 1-kilometer (km) resolution grids depicting estimated agricultural use of 199 pesticides in 1992 for the conterminous United States. Each grid cell value in the national grids of this dataset is the estimated total kilograms (kg) of a pesticide applied to row crops, small grain crops and fallow land, pasture and hay crops, and orchard and vineyard crops within the 1- by 1-km area. Nonagricultural uses of pesticides are not included in this dataset. Of the 199 pesticides represented in the grids, 92 are herbicides, 58 are insecticides, and 32 are fungicides. The remaining 17 grids are composed of the category "other pesticides", which consists of fumigants, growth regulators,...
This child item describes Python code used to retrieve gridMET climate data for a specific area and time period. Climate data were retrieved for public-supply water service areas, but the climate data collector could be used to retrieve data for other areas of interest. This dataset is part of a larger data release using machine learning to predict public supply water use for 12-digit hydrologic units from 2000-2020. Data retrieved by the climate data collector code were used as input feature variables in the public supply delivery and water use machine learning models. This page includes the following file: climate_data_collector.zip - a zip file containing the climate data collector Python code used to retrieve...
This dataset represents 9,097 basin boundaries (rdews_gages.shp) of select U.S. Geological Survey's (USGS) active and historical stream gages derived from the published datasets of stream gage basins (Wieczorek, 2006), GAGESII (Falcone, 2011), and delineated from digital elevation models found in the NHDPlus version 1 data suite (NHDPlus, 2006). These basins were created to assist in spatial processing of model inputs for the U.S. Geological Survey's (USGS) Data-Driven Drought Prediction Project of the Drought Science Program within the Water Resources Mission Area's Water Resource Availability Program.

These data were released prior to the October 1, 2016 effective date for the USGS’s policy dictating the review, approval, and release of scientific data as referenced in USGS Survey Manual Chapter 502.8 Fundamental Science Practices: Review and Approval of Scientific Data for Release. This data set represents the estimated percentage of the 1-km grid cell that is covered by or subject to the agricultural conservation practice (CPIT03), Gravity and Pressure Irrigation Source (GPI) on agricultural land by county. Gravity and Pressure Irrigation Source are described as a "combination of Gravity and Pressure Irrigation." (U.S. Department of Agriculture, 1995) This data set was created with geographic information systems...

These data were released prior to the October 1, 2016 effective date for the USGS’s policy dictating the review, approval, and release of scientific data as referenced in USGS Survey Manual Chapter 502.8 Fundamental Science Practices: Review and Approval of Scientific Data for Release. This coverage contains estimates of nitrogen-fertilizer sales for the conterminous United States in 1990 as reported by the U.S. Environmental Protection Agency (1990) and by Jerald Fletcher (West Virginia University, written commun., 1992). Nitrogen-fertilizer sales estimates in this coverage are reported for each county polygon in tons of actual nutrient sold (inorganic nitrogen, phosphate, and potash) as distinct from total tons...
These data were released prior to the October 1, 2016 effective date for the USGS’s policy dictating the review, approval, and release of scientific data as referenced in USGS Survey Manual Chapter 502.8 Fundamental Science Practices: Review and Approval of Scientific Data for Release. This is a GENERALIZED version of the boundaries and codes used for the U.S. Geological Survey's National Water-Quality Assessment (NAWQA) Program Study-Unit investigations in the conterminous United States, excluding the High Plains Regional Ground-Water Study. The data set represents the areas to be studied during the second decade of the NAWQA Program, from 2001-2012 ("cycle 2"). The coverage is intended only for drawing ILLUSTRATIONS,...
These data were released prior to the October 1, 2016 effective date for the USGS’s policy dictating the review, approval, and release of scientific data as referenced in USGS Survey Manual Chapter 502.8 Fundamental Science Practices: Review and Approval of Scientific Data for Release. This dataset includes information for 220 pesticides on the average amount (pounds) applied to 87 agricultural crops and the acres of crops treated for counties within the conterminous United States. These data were derived by combining published state pesticide use coefficients published by the National Center for Food and Agricultural Policy (NCFAP) and county harvested crop acres available from the 1997 Census of Agriculture....

These data were released prior to the October 1, 2016 effective date for the USGS’s policy dictating the review, approval, and release of scientific data as referenced in USGS Survey Manual Chapter 502.8 Fundamental Science Practices: Review and Approval of Scientific Data for Release. This coverage contains estimates of agricultural expenses in counties in the conterminous United States as reported in the 1987 Census of Agriculture (U.S. Department of Commerce, 1989a). Agricultural expenses data are reported in thousands of dollars. Agricultural expenses estimates were generated from surveys of all farms where $1,000 or more of agricultural products were sold, or normally would have been sold, during the census...

These data were released prior to the October 1, 2016 effective date for the USGS’s policy dictating the review, approval, and release of scientific data as referenced in USGS Survey Manual Chapter 502.8 Fundamental Science Practices: Review and Approval of Scientific Data for Release. This coverage contains estimates of agricultural-chemical use in counties in the conterminous United States as reported in the 1987 Census of Agriculture (U.S. Department of Commerce, 1989a). Agricultural-chemical use data are reported as either acres on which used, tons, or as a percentage of county area. Agricultural-chemical use estimates were generated from surveys of all farms where $1,000 or more of agricultural products were...

These data were released prior to the October 1, 2016 effective date for the USGS’s policy dictating the review, approval, and release of scientific data as referenced in USGS Survey Manual Chapter 502.8 Fundamental Science Practices: Review and Approval of Scientific Data for Release. This data set represents the average normalized atmospheric (wet) deposition, in kilograms, of Total Inorganic Nitrogen for the year 2002 compiled for every catchment of NHDPlus for the conterminous United States. Estimates of Total Inorganic Nitrogen deposition are based on National Atmospheric Deposition Program (NADP) measurements (B. Larsen, U.S. Geological Survey, written commun., 2007). De-trending methods applied to the year...

These data were released prior to the October 1, 2016 effective date for the USGS’s policy dictating the review, approval, and release of scientific data as referenced in USGS Survey Manual Chapter 502.8 Fundamental Science Practices: Review and Approval of Scientific Data for Release. This data set represents the average monthly precipitation in millimeters multiplied by 100 for 2002 compiled for every catchment of NHDPlus for the conterminous United States. The source data were the Near-Real-Time Monthly High-Resolution Precipitation Climate Data Set for the Conterminous United States (2002) raster dataset produced by the Spatial Climate Analysis Service at Oregon State University. The NHDPlus Version 1.1 is...
|

|
