Filters: Tags: Curry County (X)
306 results (62ms)|
Filters
Date Range
Extensions Types Contacts
Categories Tag Types Tag Schemes |
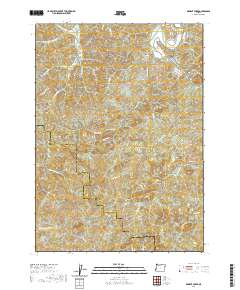
USGS Topo Map Vector Data (Vector) 30574 Mount Emily, Oregon 20200714 for 7.5 x 7.5 minute Shapefile
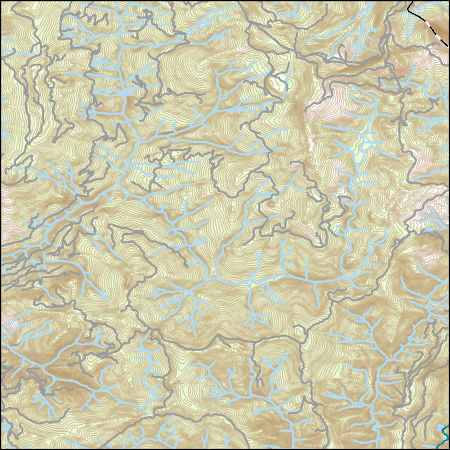
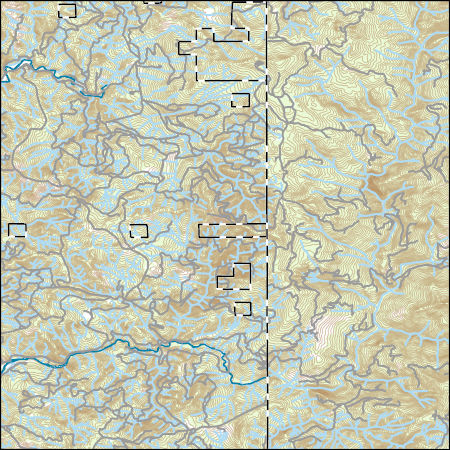
Layers of geospatial data include contours, boundaries, land cover, hydrography, roads, transportation, geographic names, structures, and other selected map features.
Types: Citation;
Tags: 7.5 x 7.5 minute,
7.5 x 7.5 minute,
Combined Vector,
Combined Vector,
Combined Vector,
This part of the data release contains historical streamflow data compiled from the literature and evaporation loss estimates used in the streamflow gain loss equation. These digital data accompany Houston, N.A., Thomas, J.V., Ging, P.B., Teeple, A.P., Pedraza, D.E., and Wallace, D.S., 2019, Pecos River Basin Salinity Assessment, Santa Rosa Lake, New Mexico to the Confluence of the Pecos River and the Rio Grande, Texas,2015: U.S. Geological Survey Scientific Investigations Report 2019-5071, https://doi.org/10.3133/sir20195071.
Categories: Data;
Types: Map Service,
OGC WFS Layer,
OGC WMS Layer,
OGC WMS Service;
Tags: Andrews County,
Avalon Lake,
Black River,
Blue Hole,
Brantley Lake,
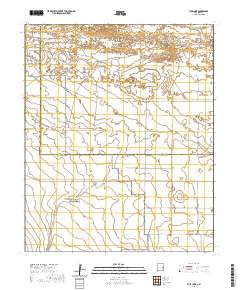
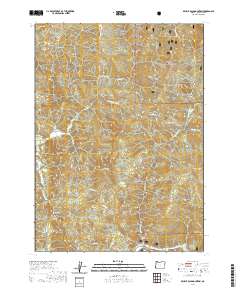
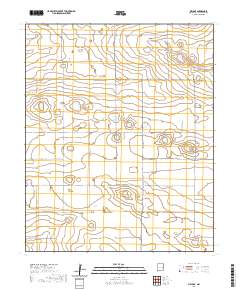
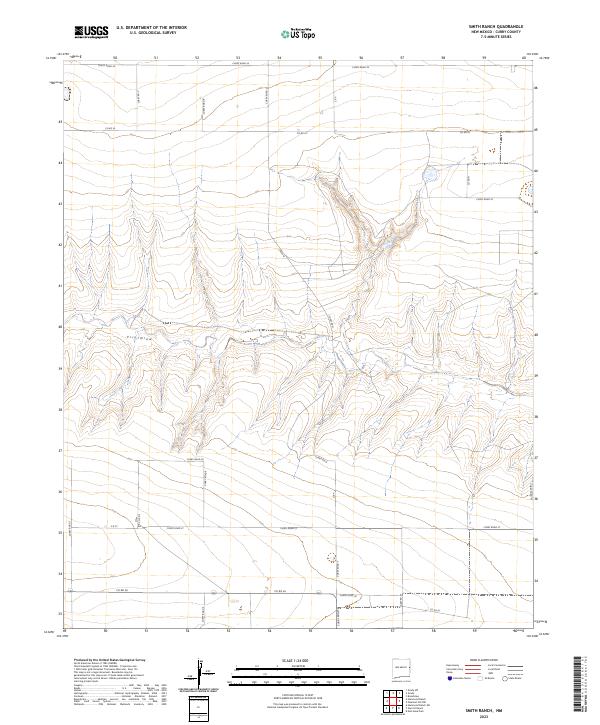
Layered geospatial PDF 7.5 Minute Quadrangle Map. Layers of geospatial data include orthoimagery, roads, grids, geographic names, elevation contours, hydrography, and other selected map features. This map is derived from GIS (geospatial information system) data. It represents a repackaging of GIS data in traditional map form, not creation of new information. The geospatial data in this map are from selected National Map data holdings and other government sources.
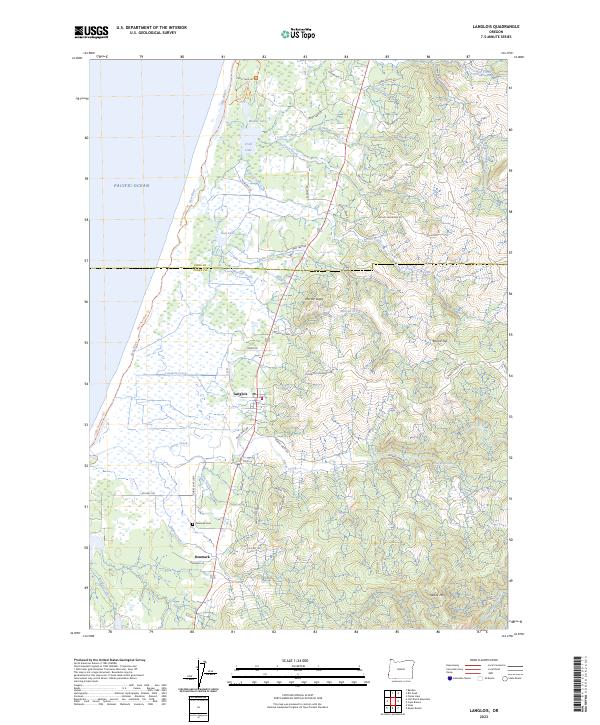
Layered geospatial PDF 7.5 Minute Quadrangle Map. Layers of geospatial data include orthoimagery, roads, grids, geographic names, elevation contours, hydrography, and other selected map features. This map is derived from GIS (geospatial information system) data. It represents a repackaging of GIS data in traditional map form, not creation of new information. The geospatial data in this map are from selected National Map data holdings and other government sources.
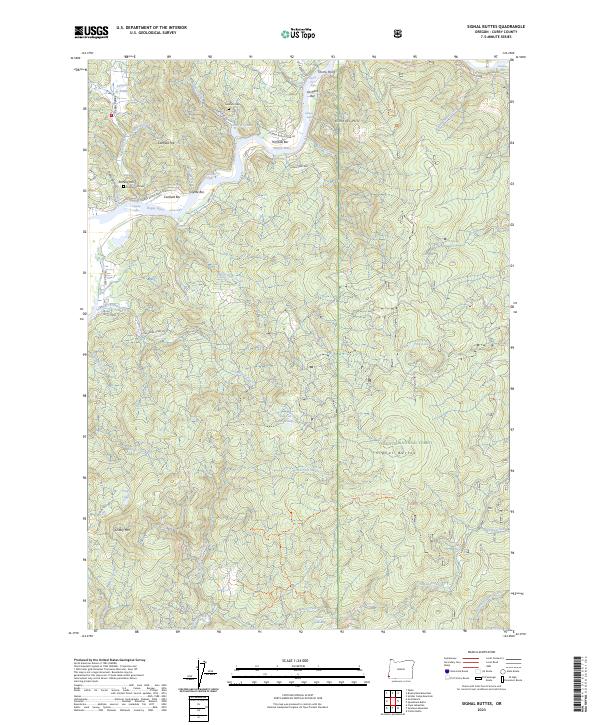
Layered geospatial PDF 7.5 Minute Quadrangle Map. Layers of geospatial data include orthoimagery, roads, grids, geographic names, elevation contours, hydrography, and other selected map features. This map is derived from GIS (geospatial information system) data. It represents a repackaging of GIS data in traditional map form, not creation of new information. The geospatial data in this map are from selected National Map data holdings and other government sources.
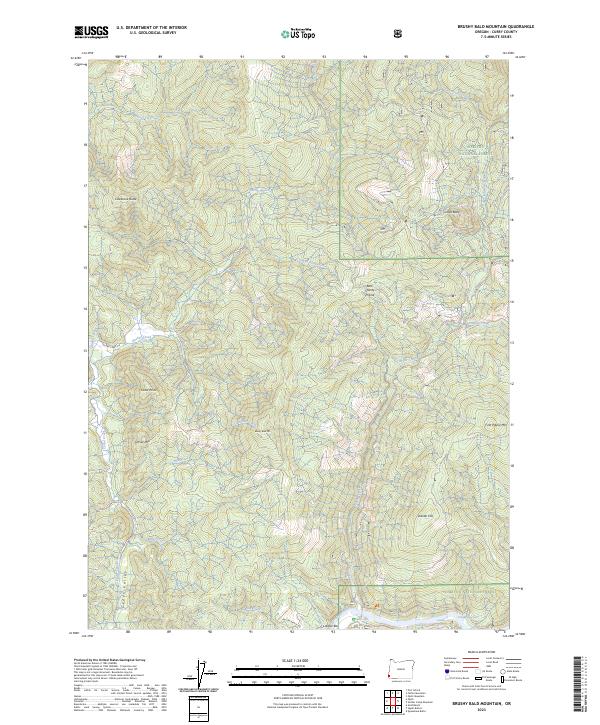
Layered geospatial PDF 7.5 Minute Quadrangle Map. Layers of geospatial data include orthoimagery, roads, grids, geographic names, elevation contours, hydrography, and other selected map features. This map is derived from GIS (geospatial information system) data. It represents a repackaging of GIS data in traditional map form, not creation of new information. The geospatial data in this map are from selected National Map data holdings and other government sources.
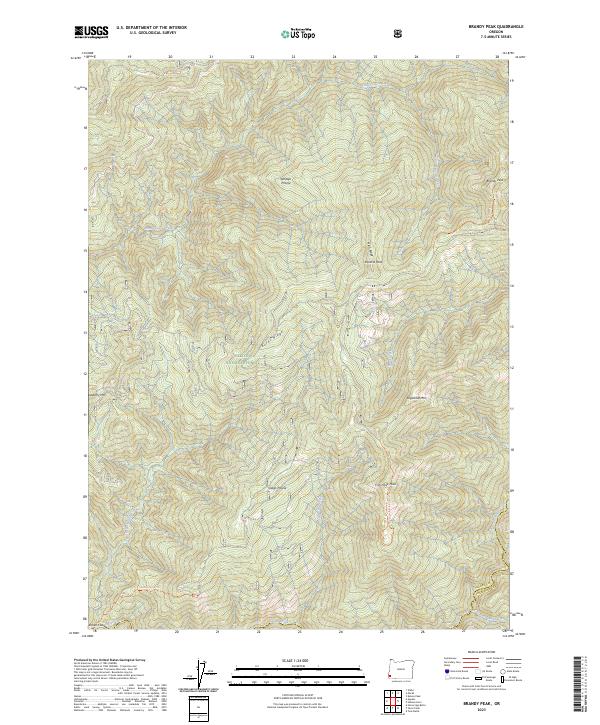
Layered geospatial PDF 7.5 Minute Quadrangle Map. Layers of geospatial data include orthoimagery, roads, grids, geographic names, elevation contours, hydrography, and other selected map features. This map is derived from GIS (geospatial information system) data. It represents a repackaging of GIS data in traditional map form, not creation of new information. The geospatial data in this map are from selected National Map data holdings and other government sources.
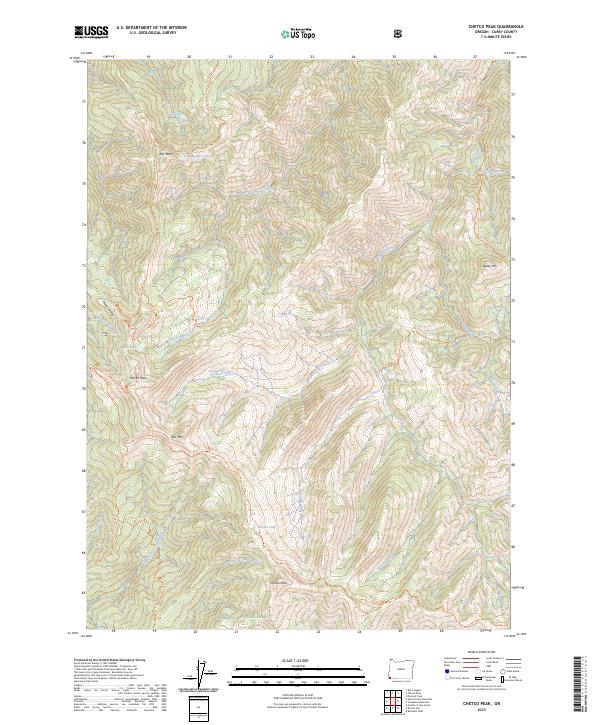
Layered geospatial PDF 7.5 Minute Quadrangle Map. Layers of geospatial data include orthoimagery, roads, grids, geographic names, elevation contours, hydrography, and other selected map features. This map is derived from GIS (geospatial information system) data. It represents a repackaging of GIS data in traditional map form, not creation of new information. The geospatial data in this map are from selected National Map data holdings and other government sources.
The hydrogeology of the Cannon Air Force Base (AFB) in Curry County, is being investigated to better understand the mechanics of groundwater flow in the area, including the identification of preferential groundwater flow paths. Mapping the top of the Dockum Group was done to help identify potential paleochannels that may have eroded the surface of the Dockum Group and subsequently filled in with coarse-grained sediments of the overlying Ogallala Formation. The Dockum Group is composed of sandstone, siltstone, mudstone, and shale that were originally deposited in fluvial and lacustrine environments (McGowen and others, 1979). The upper part of the Dockum Group is a thick layer of red clay referred to locally as the...
Layers of geospatial data include contours, boundaries, land cover, hydrography, roads, transportation, geographic names, structures, and other selected map features.
Types: Citation;
Tags: 7.5 x 7.5 minute,
7_5_Min,
Combined Vector,
Combined Vector,
Combined Vector,
Layered geospatial PDF 7.5 Minute Quadrangle Map. Layers of geospatial data include orthoimagery, roads, grids, geographic names, elevation contours, hydrography, and other selected map features. This map is derived from GIS (geospatial information system) data. It represents a repackaging of GIS data in traditional map form, not creation of new information. The geospatial data in this map are from selected National Map data holdings and other government sources.

These data were released prior to the October 1, 2016 effective date for the USGS’s policy dictating the review, approval, and release of scientific data as referenced in USGS Survey Manual Chapter 502.8 Fundamental Science Practices: Review and Approval of Scientific Data for Release. Hunter Creek is an unregulated system that drains 115 square kilometers of southwestern Oregon before flowing into the Pacific Ocean south of the town of Gold Beach, Oregon. In cooperation with the U.S. Army Corps of Engineers, the U.S. Geological Survey completed a reconnaissance-level assessment of channel condition and bed-material transport relevant to the permitting of in-stream gravel extraction in the lower 12.4 kilometers...
Layered geospatial PDF 7.5 Minute Quadrangle Map. Layers of geospatial data include orthoimagery, roads, grids, geographic names, elevation contours, hydrography, and other selected map features. This map is derived from GIS (geospatial information system) data. It represents a repackaging of GIS data in traditional map form, not creation of new information. The geospatial data in this map are from selected National Map data holdings and other government sources.
Layered geospatial PDF 7.5 Minute Quadrangle Map. Layers of geospatial data include orthoimagery, roads, grids, geographic names, elevation contours, hydrography, and other selected map features. This map is derived from GIS (geospatial information system) data. It represents a repackaging of GIS data in traditional map form, not creation of new information. The geospatial data in this map are from selected National Map data holdings and other government sources.
Layered geospatial PDF 7.5 Minute Quadrangle Map. Layers of geospatial data include orthoimagery, roads, grids, geographic names, elevation contours, hydrography, and other selected map features. This map is derived from GIS (geospatial information system) data. It represents a repackaging of GIS data in traditional map form, not creation of new information. The geospatial data in this map are from selected National Map data holdings and other government sources.
Layered geospatial PDF 7.5 Minute Quadrangle Map. Layers of geospatial data include orthoimagery, roads, grids, geographic names, elevation contours, hydrography, and other selected map features. This map is derived from GIS (geospatial information system) data. It represents a repackaging of GIS data in traditional map form, not creation of new information. The geospatial data in this map are from selected National Map data holdings and other government sources.
Layered geospatial PDF 7.5 Minute Quadrangle Map. Layers of geospatial data include orthoimagery, roads, grids, geographic names, elevation contours, hydrography, and other selected map features. This map is derived from GIS (geospatial information system) data. It represents a repackaging of GIS data in traditional map form, not creation of new information. The geospatial data in this map are from selected National Map data holdings and other government sources.
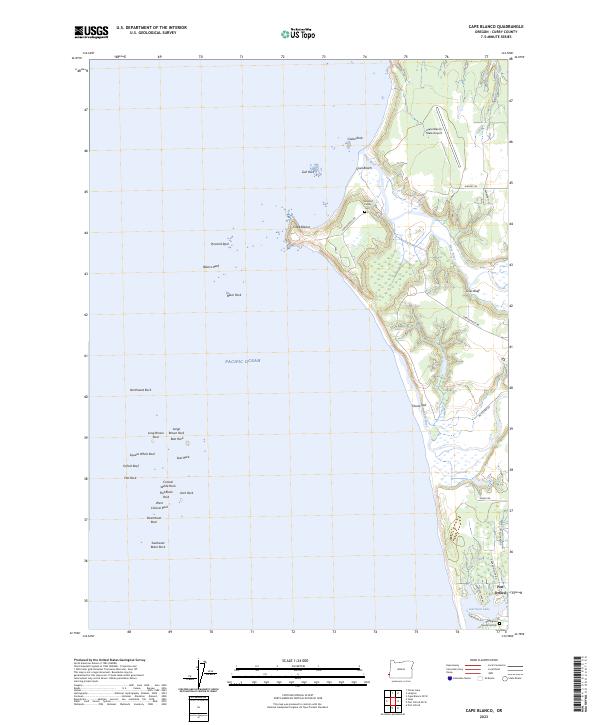
This publication releases single-beam bathymetry and backscatter datasets acquired by the U.S. Geological Survey (USGS) during surveys performed on Floras Lake, Oregon, in June 2018. Bathymetry and backscatter data were collected using two personal watercraft (PWCs) equipped with single-beam sonar systems, sidescan sonar systems, and global navigation satellite system (GNSS) receivers. Bathymetry data are provided as point data in a comma-separated text file and are projected in cartesian coordinates using the Universal Transverse Mercator (UTM), Zone 10 North, meters coordinate system, with elevations relative to the NAVD88 vertical datum. Acoustic-backscatter data are provided as a GeoTIFF file also projected...
Categories: Data;
Tags: Bathymetry and Elevation,
CMHRP,
Cape Blanco,
Coastal and Marine Hazards and Resources Program,
Curry County,
Layers of geospatial data include contours, boundaries, land cover, hydrography, roads, transportation, geographic names, structures, and other selected map features.
Types: Citation;
Tags: 7.5 x 7.5 minute,
7.5 x 7.5 minute,
Combined Vector,
Combined Vector,
Combined Vector,
Layers of geospatial data include contours, boundaries, land cover, hydrography, roads, transportation, geographic names, structures, and other selected map features.
Types: Citation;
Tags: 7.5 x 7.5 minute,
7.5 x 7.5 minute,
Combined Vector,
Combined Vector,
Combined Vector,
|

|
