Filters: Tags: Dade County (X)
99 results (159ms)|
Filters
Date Range
Extensions Types
Contacts
Categories Tag Types Tag Schemes |
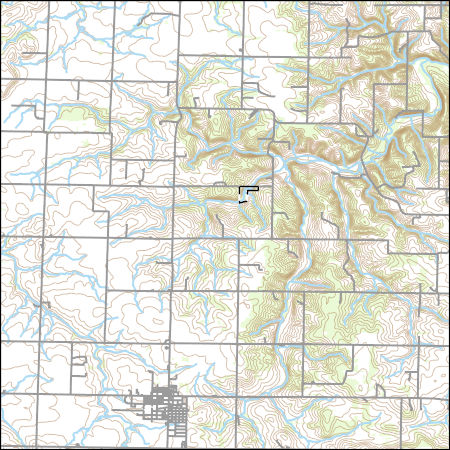
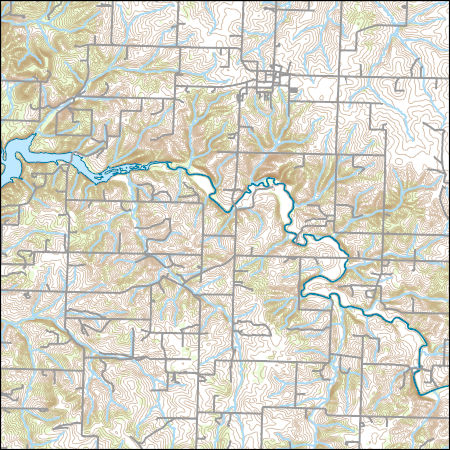
Layers of geospatial data include contours, boundaries, land cover, hydrography, roads, transportation, geographic names, structures, and other selected map features.
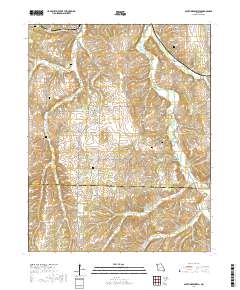
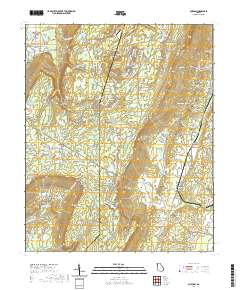
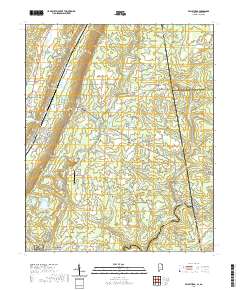
Layered geospatial PDF 7.5 Minute Quadrangle Map. Layers of geospatial data include orthoimagery, roads, grids, geographic names, elevation contours, hydrography, and other selected map features. This map is derived from GIS (geospatial information system) data. It represents a repackaging of GIS data in traditional map form, not creation of new information. The geospatial data in this map are from selected National Map data holdings and other government sources.
Types: Citation;
Tags: 7.5 x 7.5 minute,
Dade County,
Downloadable Data,
EarthCover,
Geospatial PDF,
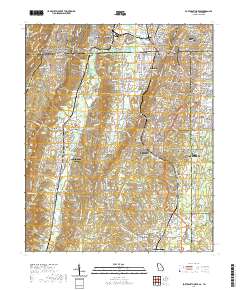
Layered geospatial PDF 7.5 Minute Quadrangle Map. Layers of geospatial data include orthoimagery, roads, grids, geographic names, elevation contours, hydrography, and other selected map features. This map is derived from GIS (geospatial information system) data. It represents a repackaging of GIS data in traditional map form, not creation of new information. The geospatial data in this map are from selected National Map data holdings and other government sources.
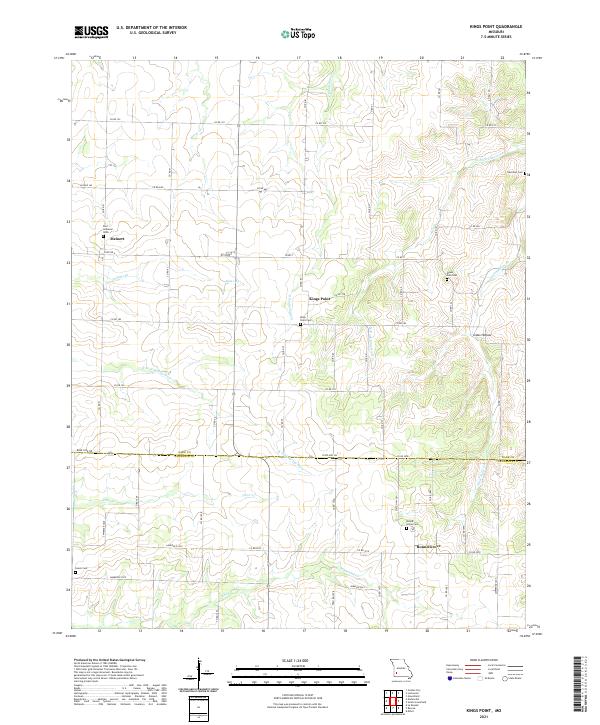
Layered geospatial PDF 7.5 Minute Quadrangle Map. Layers of geospatial data include orthoimagery, roads, grids, geographic names, elevation contours, hydrography, and other selected map features. This map is derived from GIS (geospatial information system) data. It represents a repackaging of GIS data in traditional map form, not creation of new information. The geospatial data in this map are from selected National Map data holdings and other government sources.
Layered geospatial PDF 7.5 Minute Quadrangle Map. Layers of geospatial data include orthoimagery, roads, grids, geographic names, elevation contours, hydrography, and other selected map features. This map is derived from GIS (geospatial information system) data. It represents a repackaging of GIS data in traditional map form, not creation of new information. The geospatial data in this map are from selected National Map data holdings and other government sources.
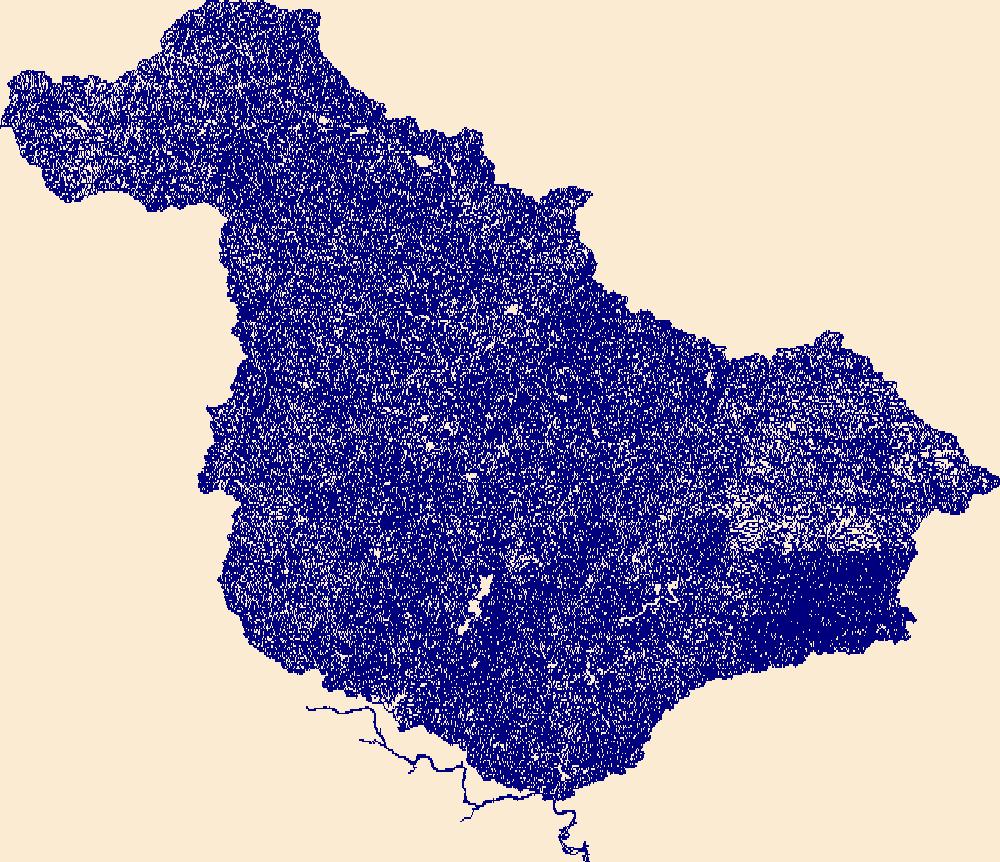
The High Resolution National Hydrography Dataset Plus (NHDPlus HR) is an integrated set of geospatial data layers, including the best available National Hydrography Dataset (NHD), the 10-meter 3D Elevation Program Digital Elevation Model (3DEP DEM), and the National Watershed Boundary Dataset (WBD). The NHDPlus HR combines the NHD, 3DEP DEMs, and WBD to create a stream network with linear referencing, feature naming, "value added attributes" (VAAs), elevation-derived catchments, and other features for hydrologic data analysis. The stream network with linear referencing is a system of data relationships applied to hydrographic systems so that one stream reach "flows" into another and "events" can be tied to and traced...
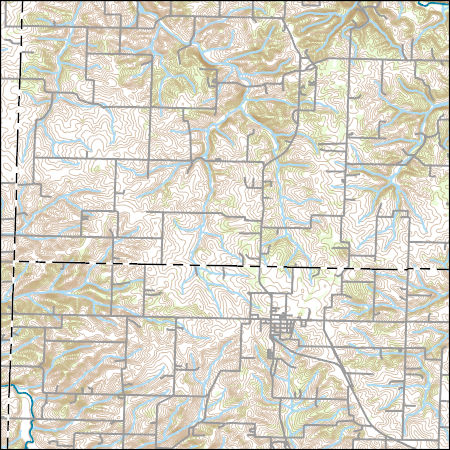
Layers of geospatial data include contours, boundaries, land cover, hydrography, roads, transportation, geographic names, structures, and other selected map features.
Layered geospatial PDF 7.5 Minute Quadrangle Map. Layers of geospatial data include orthoimagery, roads, grids, geographic names, elevation contours, hydrography, and other selected map features. This map is derived from GIS (geospatial information system) data. It represents a repackaging of GIS data in traditional map form, not creation of new information. The geospatial data in this map are from selected National Map data holdings and other government sources.
The U.S. Geological Survey (USGS), in cooperation with Miami-Dade County, mapped the approximate inland extent of saltwater intrusion in eastern Miami-Dade County in 2018. This approximation required acquisition and compilation of relevant data collected by the organizations: Florida Department of Environmental Protection (FDEP), Florida Keys Aqueduct Authority (FKAA), Florida Power & Light Company (FPL), MacVicar Consulting Inc., Miami-Dade County Regulatory and Economic Resources (MD-RER), the South Florida Water Management District (SFWMD), and the USGS. Data from the selected monitoring wells were entered into a geographic information system (GIS) for analysis and mapping. The approximate saltwater interface...
Layered geospatial PDF 7.5 Minute Quadrangle Map. Layers of geospatial data include orthoimagery, roads, grids, geographic names, elevation contours, hydrography, and other selected map features. This map is derived from GIS (geospatial information system) data. It represents a repackaging of GIS data in traditional map form, not creation of new information. The geospatial data in this map are from selected National Map data holdings and other government sources.
Layered geospatial PDF 7.5 Minute Quadrangle Map. Layers of geospatial data include orthoimagery, roads, grids, geographic names, elevation contours, hydrography, and other selected map features. This map is derived from GIS (geospatial information system) data. It represents a repackaging of GIS data in traditional map form, not creation of new information. The geospatial data in this map are from selected National Map data holdings and other government sources.
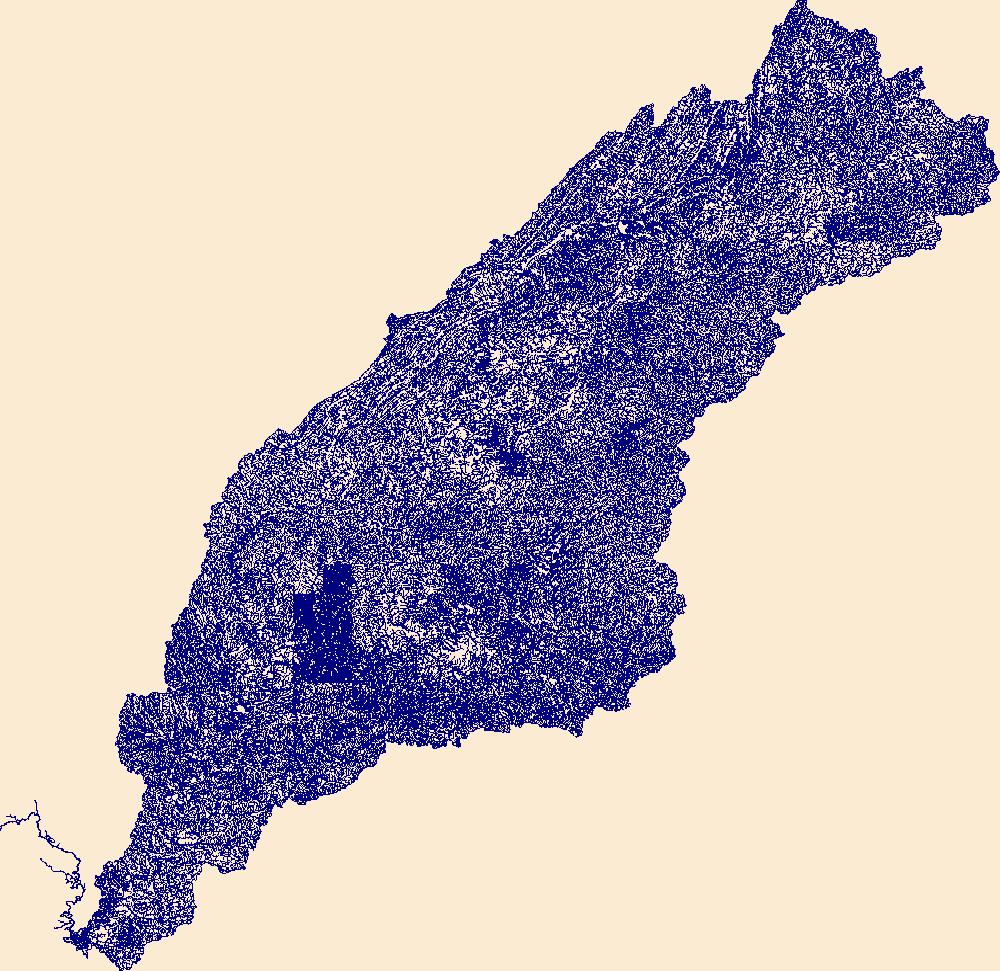
The High Resolution National Hydrography Dataset Plus (NHDPlus HR) is an integrated set of geospatial data layers, including the best available National Hydrography Dataset (NHD), the 10-meter 3D Elevation Program Digital Elevation Model (3DEP DEM), and the National Watershed Boundary Dataset (WBD). The NHDPlus HR combines the NHD, 3DEP DEMs, and WBD to create a stream network with linear referencing, feature naming, "value added attributes" (VAAs), elevation-derived catchments, and other features for hydrologic data analysis. The stream network with linear referencing is a system of data relationships applied to hydrographic systems so that one stream reach "flows" into another and "events" can be tied to and traced...

Layers of geospatial data include contours, boundaries, land cover, hydrography, roads, transportation, geographic names, structures, and other selected map features.
Layers of geospatial data include contours, boundaries, land cover, hydrography, roads, transportation, geographic names, structures, and other selected map features.
USGS Topo Map Vector Data (Vector) 45613 Trenton, Georgia 20200914 for 7.5 x 7.5 minute FileGDB 10.1
Layers of geospatial data include contours, boundaries, land cover, hydrography, roads, transportation, geographic names, structures, and other selected map features.
Airborne electromagnetic (AEM) and magnetic survey data were collected in Big Cypress National Preserve, Florida as part of a larger survey. Data were collected during October 2001. The Big Cypress National Preserve part was the largest of three segments, totaling 2692.2 line-kilometers. Electromagnetic data were acquired with Dighem VRES frequency-domain system. Magnetic data were collected with a Scintrex CS2 cesium-vapor magnetometer. The line spacing was 400 m and several tie lines were flown. The nominal elevation of electromagnetic system was 30 m. This data release includes raw and processed AEM data. This release also includes unprocessed and processed magnetic data that have been drift corrected.
Categories: Data;
Types: Downloadable,
Map Service,
OGC WFS Layer,
OGC WMS Layer,
Shapefile;
Tags: Big Cypress National Preserve,
City of Homestead,
Dade County,
Everglades National Park,
Florida Bay,
Airborne electromagnetic (AEM) and magnetic survey data were collected near Homestead, Florida as part of a larger survey. Data were collected during October 2001. The Homestead part of the survey consisted of 277.1 line-kilometers. Electromagnetic data were acquired with Dighem VRES frequency-domain system. Magnetic data were collected with a Scintrex CS2 cesium-vapor magnetometer. The line spacing was 400 m and a single tie line was flown in the middle of the survey area. The nominal elevation of the electromagnetic system was 30 m. This data release includes raw and processed AEM data. This release also includes unprocessed and processed magnetic data that have been drift corrected.
Categories: Data;
Types: Downloadable,
Map Service,
OGC WFS Layer,
OGC WMS Layer,
Shapefile;
Tags: Big Cypress National Preserve,
City of Homestead,
Dade County,
Everglades National Park,
Florida Bay,
Layers of geospatial data include contours, boundaries, land cover, hydrography, roads, transportation, geographic names, structures, and other selected map features.
Layers of geospatial data include contours, boundaries, land cover, hydrography, roads, transportation, geographic names, structures, and other selected map features.
Layers of geospatial data include contours, boundaries, land cover, hydrography, roads, transportation, geographic names, structures, and other selected map features.
|

|
