Filters: Tags: DeKalb County (X)
387 results (115ms)|
Filters
Date Range
Extensions Types Contacts
Categories Tag Types
|
Layered geospatial PDF 7.5 Minute Quadrangle Map. Layers of geospatial data include orthoimagery, roads, grids, geographic names, elevation contours, hydrography, and other selected map features. This map is derived from GIS (geospatial information system) data. It represents a repackaging of GIS data in traditional map form, not creation of new information. The geospatial data in this map are from selected National Map data holdings and other government sources.
Layers of geospatial data include contours, boundaries, land cover, hydrography, roads, transportation, geographic names, structures, and other selected map features.
Types: Citation;
Tags: 7.5 x 7.5 minute,
7_5_Min,
Combined Vector,
Combined Vector,
Combined Vector,
Layered geospatial PDF 7.5 Minute Quadrangle Map. Layers of geospatial data include orthoimagery, roads, grids, geographic names, elevation contours, hydrography, and other selected map features. This map is derived from GIS (geospatial information system) data. It represents a repackaging of GIS data in traditional map form, not creation of new information. The geospatial data in this map are from selected National Map data holdings and other government sources.
Layered geospatial PDF 7.5 Minute Quadrangle Map. Layers of geospatial data include orthoimagery, roads, grids, geographic names, elevation contours, hydrography, and other selected map features. This map is derived from GIS (geospatial information system) data. It represents a repackaging of GIS data in traditional map form, not creation of new information. The geospatial data in this map are from selected National Map data holdings and other government sources.
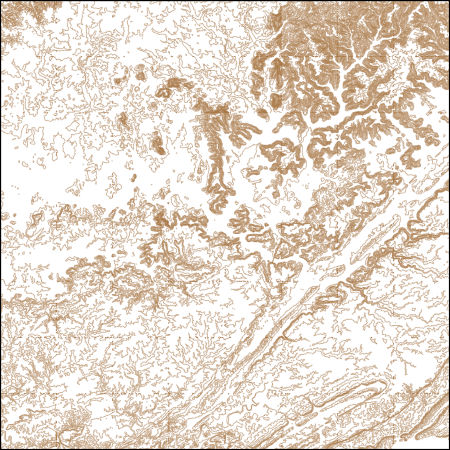
These vector contour lines are derived from the 3D Elevation Program using automated and semi-automated processes. They were created to support 1:24,000-scale CONUS and Hawaii, 1:25,000-scale Alaska, and 1:20,000-scale Puerto Rico / US Virgin Island topographic map products, but are also published in this GIS vector format. Contour intervals are assigned by 7.5-minute quadrangle, so this vector dataset is not visually seamless across quadrangle boundaries. The vector lines have elevation attributes (in feet above mean sea level on NAVD88), but this dataset does not carry line symbols or annotation.

These vector contour lines are derived from the 3D Elevation Program using automated and semi-automated processes. They were created to support 1:24,000-scale CONUS and Hawaii, 1:25,000-scale Alaska, and 1:20,000-scale Puerto Rico / US Virgin Island topographic map products, but are also published in this GIS vector format. Contour intervals are assigned by 7.5-minute quadrangle, so this vector dataset is not visually seamless across quadrangle boundaries. The vector lines have elevation attributes (in feet above mean sea level on NAVD88), but this dataset does not carry line symbols or annotation.

These vector contour lines are derived from the 3D Elevation Program using automated and semi-automated processes. They were created to support 1:24,000-scale CONUS and Hawaii, 1:25,000-scale Alaska, and 1:20,000-scale Puerto Rico / US Virgin Island topographic map products, but are also published in this GIS vector format. Contour intervals are assigned by 7.5-minute quadrangle, so this vector dataset is not visually seamless across quadrangle boundaries. The vector lines have elevation attributes (in feet above mean sea level on NAVD88), but this dataset does not carry line symbols or annotation.
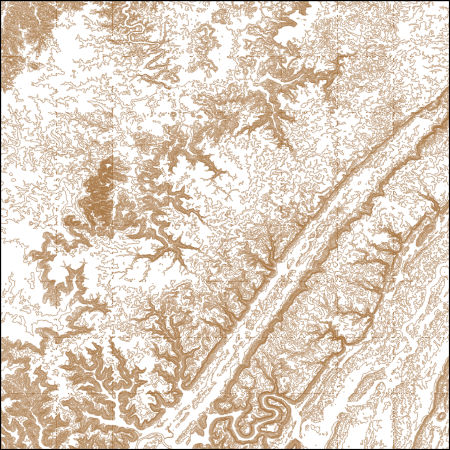
These vector contour lines are derived from the 3D Elevation Program using automated and semi-automated processes. They were created to support 1:24,000-scale CONUS and Hawaii, 1:25,000-scale Alaska, and 1:20,000-scale Puerto Rico / US Virgin Island topographic map products, but are also published in this GIS vector format. Contour intervals are assigned by 7.5-minute quadrangle, so this vector dataset is not visually seamless across quadrangle boundaries. The vector lines have elevation attributes (in feet above mean sea level on NAVD88), but this dataset does not carry line symbols or annotation.
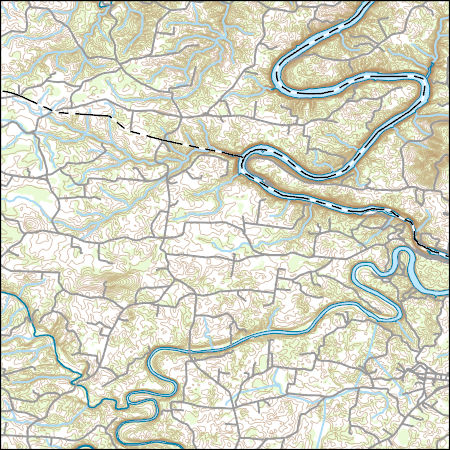
Layers of geospatial data include contours, boundaries, land cover, hydrography, roads, transportation, geographic names, structures, and other selected map features.
Types: Citation;
Tags: 7.5 x 7.5 minute,
7_5_Min,
Combined Vector,
Combined Vector,
Combined Vector,
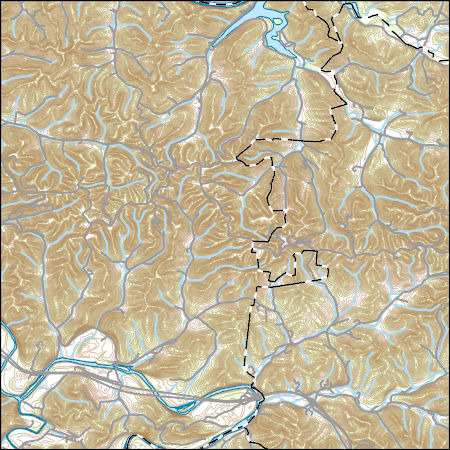
Layers of geospatial data include contours, boundaries, land cover, hydrography, roads, transportation, geographic names, structures, and other selected map features.
Types: Citation;
Tags: 7.5 x 7.5 minute,
7_5_Min,
Combined Vector,
Combined Vector,
Combined Vector,
Layers of geospatial data include contours, boundaries, land cover, hydrography, roads, transportation, geographic names, structures, and other selected map features.
Types: Citation;
Tags: 7.5 x 7.5 minute,
7_5_Min,
Combined Vector,
Combined Vector,
Combined Vector,
Layers of geospatial data include contours, boundaries, land cover, hydrography, roads, transportation, geographic names, structures, and other selected map features.
Layers of geospatial data include contours, boundaries, land cover, hydrography, roads, transportation, geographic names, structures, and other selected map features.
Types: Citation;
Tags: 7.5 x 7.5 minute,
7_5_Min,
Combined Vector,
Combined Vector,
Combined Vector,
Water supply lakes are the primary source of water for many communities in northern and western Missouri. Therefore, accurate and up-to-date estimates of lake capacity are important for managing and predicting adequate water supply. Many of the water supply lakes in Missouri were previously surveyed by the U.S. Geological Survey (USGS) in the early 2000s (Richards, 2013) and in 2013 (Huizinga, 2014); however, years of potential sedimentation may have resulted in reduced water storage capacity. Periodic bathymetric surveys are useful to update the area/capacity table and to determine changes in the bathymetric surface. Cameron Reservoir Number 2 is a water supply lake used by the city of Cameron in northwestern...
Water supply lakes are the primary source of water for many communities in northern and western Missouri. Therefore, accurate and up-to-date estimates of lake capacity are important for managing and predicting adequate water supply. Many of the water supply lakes in Missouri were previously surveyed by the U.S. Geological Survey (USGS) in the early 2000s (Richards, 2013) and in 2013 (Huizinga, 2014); however, years of potential sedimentation may have resulted in reduced water storage capacity. Periodic bathymetric surveys are useful to update the area/capacity table and to determine changes in the bathymetric surface. Cameron Reservoir Number 1 is a water supply lake used by the city of Cameron in northwestern...
Water supply lakes are the primary source of water for many communities in northern and western Missouri. Therefore, accurate and up-to-date estimates of lake capacity are important for managing and predicting adequate water supply. Many of the water supply lakes in Missouri were previously surveyed by the U.S. Geological Survey (USGS) in the early 2000s (Richards, 2013) and in 2013 (Huizinga, 2014); however, years of potential sedimentation may have resulted in reduced water storage capacity. Periodic bathymetric surveys are useful to update the area/capacity table and to determine changes in the bathymetric surface. In April and May 2022, the USGS, in cooperation with the Missouri Department of Natural Resources...
Layers of geospatial data include contours, boundaries, land cover, hydrography, roads, transportation, geographic names, structures, and other selected map features.
An investigation was completed by the U.S. Geological Survey in cooperation with the Indiana Office of Community and Rural Affairs that found 1,132 transportation and utility assets in Indiana are vulnerable to fluvial erosion hazards due to close proximity to actively migrating streams. Locations of transportation assets (bridges, roadways, and railroad lines) and selected utility assets (high-capacity overhead power-transmission lines, underground pipelines, water treatment facilities, and in-channel dams) were determined using aerial imagery hosted by the Google Earth platform. Identified assets were aggregated by stream reach, county, and class. The contents of this data release include (1) a comma-delimited...
Categories: Data;
Types: Citation,
Map Service,
OGC WFS Layer,
OGC WMS Layer,
OGC WMS Service;
Tags: Adams County,
Allen County,
Bartholomew County,
Benton County,
Blackford County,
In 2019, dye tracing investigations were conducted near Manitou Cave in Dekalb County, northeast Alabama. The purpose of the dye tracing was to delineate a recharge area for the stream in Manitou Cave, a 1.7-kilometer-long stream cave and the only known habitat for the Manitou Cavesnail (Antroribus breweri). In 2010, the U.S. Fish and Wildlife Service was petitioned by the Center for Biological Diversity to federally list the Manitou Cavesnail. However, before any listing or vulnerability designation can occur, more knowledge was required, specifically regarding potential threats to the snail. With regards to the Manitou Cavesnail, this required delineating a recharge for the stream in Manitou Cave in order to determine...
Categories: Data;
Types: ArcGIS REST Map Service,
ArcGIS Service Definition,
Downloadable,
Map Service;
Tags: Alabama,
Antroribus breweri,
Aquatic Biology,
Dekalb County,
Fort Payne,
Layers of geospatial data include contours, boundaries, land cover, hydrography, roads, transportation, geographic names, structures, and other selected map features.
Types: Citation;
Tags: 7.5 x 7.5 minute,
7.5 x 7.5 minute,
Combined Vector,
Combined Vector,
Combined Vector,
|

|
