Filters: Tags: District of Columbia (X)
323 results (116ms)|
Filters
Date Range
Extensions
Types Contacts
Categories
Tag Types
|
This data set represents the results of calculations of hazard curves for a grid of points with a spacing of 0.05 degrees in latitude and longitude. It represents the chance of experiencing damaging earthquakes for fixed ground shaking levels that corresponds with MMI = VI. The values are obtained by averaging the probability of experiencing MMI = VI based on a peak ground acceleration value of 0.1155 g for site class D, and the probability of experiencing MMI = VI based on 1.0-second spectral acceleration value of 0.102 g for site class D. The data are for the Central and Eastern United States and are based on the one-year model.
Categories: Data;
Types: Citation,
Downloadable,
Map Service,
OGC WFS Layer,
OGC WMS Layer,
Shapefile;
Tags: Alabama,
Arizona,
Arkansas,
Colorado,
Connecticut,
This data set represents the hazard curves for a grid of points with a spacing of 0.05 degrees in latitude and longitude. It represents the annual rate of exceedance versus peak ground acceleration.
This data set provides industrial-scale onshore wind turbine locations, corresponding facility information, and turbine technical specifications, in the United States to March 2014. The database has nearly 49,000 wind turbine records that have been collected, digitized, locationally verified, and internally quality assured and quality controlled. Turbines from the Federal Aviation Administration Digital Obstacle File, product date March 2, 2014, were used as the primary source of turbine data points. Verification of the position of turbines was done by visual interpretation using high-resolution aerial imagery in ESRI ArcGIS Desktop. Turbines without Federal Aviation Administration Obstacle Repository System (FAA...
Categories: Data;
Types: ArcGIS REST Map Service,
Citation,
Map Service;
Tags: Alabama,
Alaska,
Arizona,
Arkansas,
California,
This dataset represents the connections between each nearby pair of 2080 cores for Cerulean warbler. It is intended to highlight areas important for connecting cores and to visually represent the connections among refugia cores.
Categories: Data;
Types: Downloadable,
GeoTIFF,
Map Service,
Raster;
Tags: Connecticut,
Delaware,
District of Columbia,
Maine,
Maryland,
This dataset represents the results (9/30/2008) of the Northeastern Aquatic Habitat Classification System (NAHCS) GIS map for streams and rivers. This classification focused on mapping a stream habitat types across 13 northeastern states (ME, NH, VT, MA, CT, RI, NY, NJ, PA, MD, DC, DE, VA, WV). Stream and river centerlines were extracted from the USGS National Hydrography Dataset Plus (NH-Plus) 2006 1:100,000 data. These reaches were attributed and placed into classes representing their biopysical setting in terms of stream size, gradient, and geology, and expected natural water temperature regime. Please see the attribute descriptions for more information on the variable thresholds and the summary taxonomy.
Categories: Data;
Types: ArcGIS REST Map Service,
ArcGIS Service Definition,
Downloadable,
Map Service;
Tags: Connecticut,
Delaware,
District of Columbia,
Hydrography,
Maine,
To quantify the potential for landward migration at the estuary level, we developed a geospatial dataset for the conterminous United States (CONUS) that identifies the boundaries for estuarine drainage areas. Nine estuarine drainage areas in south Florida were delineated using data developed by the South Florida Water Management District (SFWMD 2018). For the rest of CONUS, we used information contained within the National Fish Habitat Action Plan (NFHAP) - Coastal Spatial Framework (CSF) (National Centers for Coastal Ocean Science 2021). The original NFHAP-CSF data included 612 drainage areas, which were too many for our purposes. Therefore, we merged smaller drainage areas with larger, adjacent drainage areas...
We quantified the potential area available for landward migration of tidal saline wetlands and freshwater wetlands due to sea-level rise (SLR) at the estuary scale for 166 estuarine drainage areas and at the state scale for 22 coastal states and District of Columbia. We used 2016 Coastal Change Analysis Program (C-CAP) data in combination with the future wetland migration data under the 1.5 m global SLR scenario to evaluate the potential for wetland migration into all the individual C-CAP classes and into the following six land cover categories: (1) freshwater forest (wetland); (2) freshwater marsh (wetland); (3) terrestrial forest (upland); (4) terrestrial grassland (upland); (5) agricultural croplands (upland);...
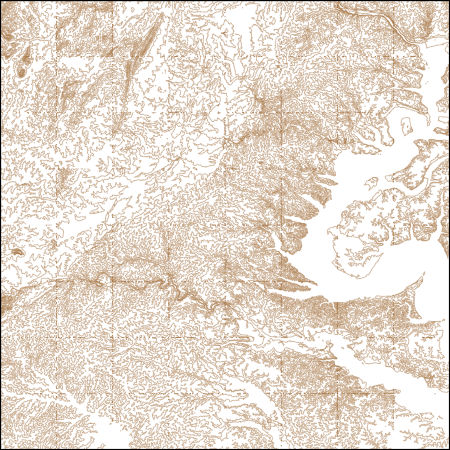
These vector contour lines are derived from the 3D Elevation Program using automated and semi-automated processes. They were created to support 1:24,000-scale CONUS and Hawaii, 1:25,000-scale Alaska, and 1:20,000-scale Puerto Rico / US Virgin Island topographic map products, but are also published in this GIS vector format. Contour intervals are assigned by 7.5-minute quadrangle, so this vector dataset is not visually seamless across quadrangle boundaries. The vector lines have elevation attributes (in feet above mean sea level on NAVD88), but this dataset does not carry line symbols or annotation.
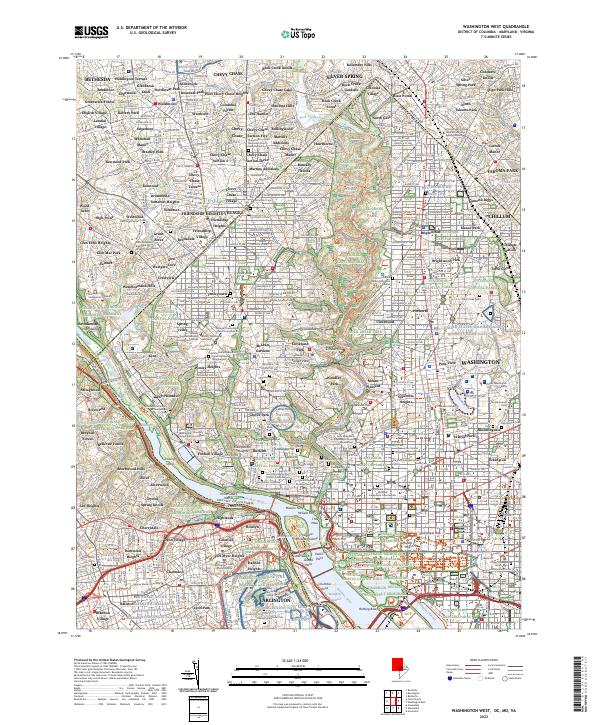
Layered geospatial PDF 7.5 Minute Quadrangle Map. Layers of geospatial data include orthoimagery, roads, grids, geographic names, elevation contours, hydrography, and other selected map features. This map is derived from GIS (geospatial information system) data. It represents a repackaging of GIS data in traditional map form, not creation of new information. The geospatial data in this map are from selected National Map data holdings and other government sources.
The U.S. Geological Survey is developing national water-use models to support water resources management in the United States. Model benefits include a nationally consistent estimation approach, greater temporal and spatial resolution of estimates, efficient and automated updates of results, and capabilities to forecast water use into the future and assess model uncertainty. This data release contains data used in a machine learning model to estimate monthly water use for communities that are supplied by public-supply water systems in the conterminous United States for 2000-2020. This data release also contains associated scripts used to produce input features as well as model output values by 12-digit hydrologic...
Layers of geospatial data include roads, airports, trails, and railroads.

The Geographic Names Information System (GNIS) is the Federal standard for geographic nomenclature. The U.S. Geological Survey developed the GNIS for the U.S. Board on Geographic Names, a Federal inter-agency body chartered by public law to maintain uniform feature name usage throughout the Government and to promulgate standard names to the public. The GNIS is the official repository of domestic geographic names data; the official vehicle for geographic names use by all departments of the Federal Government; and the source for applying geographic names to Federal electronic and printed products of all types.
The Geographic Names Information System (GNIS) is the Federal standard for geographic nomenclature. The U.S. Geological Survey developed the GNIS for the U.S. Board on Geographic Names, a Federal inter-agency body chartered by public law to maintain uniform feature name usage throughout the Government and to promulgate standard names to the public. The GNIS is the official repository of domestic geographic names data; the official vehicle for geographic names use by all departments of the Federal Government; and the source for applying geographic names to Federal electronic and printed products of all types.
This dataset was created to support the Washington D.C. StreamStats project funded by the Washington D.C. Department of Energy and Environment (DOEE). The dataset contains digital elevation model (DEM), flow direction and catchment layers that were conditioned using Washingtons D.C.’s stormwater network layer. The data are hosted online as a component of the USGS StreamStats web application (https://streamstats.usgs.gov), where users can interact with a map of Washington D.C.’s stormwater pipe system and National Hydrography Dataset (NHD) “best resolution” blue lines to delineate drainage basins that account for pipe flow. This project utilized 1-meter (high resolution) terrain products, which improves upon existing...
This data release contains three 10-meter resolution GeoTIFFs representing 10-meter (35-foot), 30-meter (100-foot) and 90-meter (300-foot) riparian buffer zones along shorelines, rivers, streams, and other lotic (flowing) water features. The layers are binary, where the value of each cell represents the presence or absence of the buffer zone. In addition, the data release contains shapefile layers that document the extent of corrections that were made to the data to address errors in the stream network (see processing steps section for more details). The methodology combines various fine-scale input layers, including a 1:24k stream network and Chesapeake Bay 1-meter resolution Land Use/Land Cover to approximate...
Types: Map Service,
OGC WFS Layer,
OGC WMS Layer,
OGC WMS Service;
Tags: Chesapeake,
Delaware,
District of Columbia,
Ecology,
Forestry,
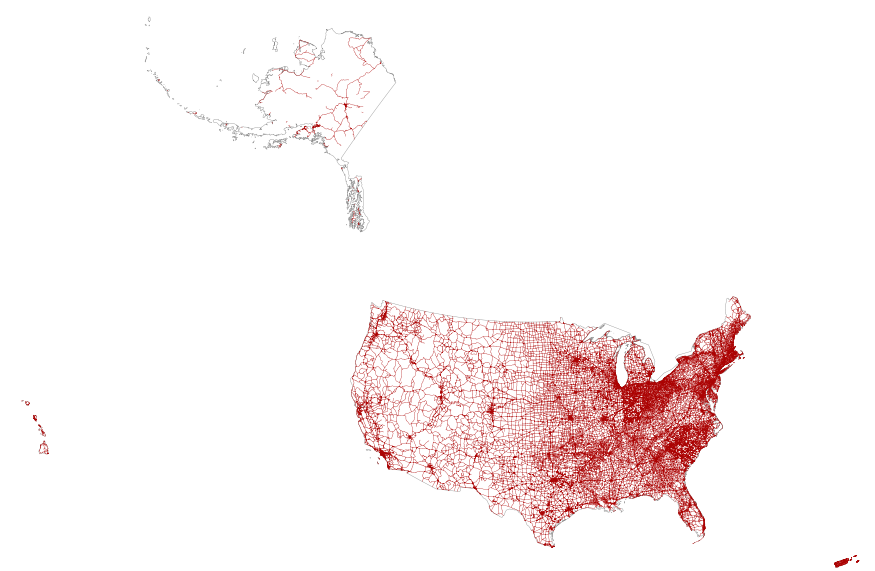
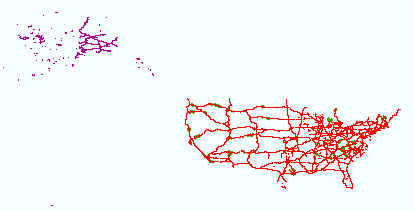
This map layer portrays the major roads in the United States, Puerto Rico, and the U.S. Virgin Islands. The file was produced by joining the individual State roads layers from the National Highway Planning Network (NHPN), Geographic Data Technology (GDT) Dynamap, and TIGER/Line files. This is a revised version of the July 2012 map layer.
A one-year seismic hazard forecast for the Central and Eastern United States, based on induced and natural earthquakes, has been produced by the U.S. Geological Survey. The model assumes that earthquake rates calculated from several different time windows will remain relatively stationary and can be used to forecast earthquake hazard and damage intensity for the year 2016. This assessment is the first step in developing an operational earthquake forecast for the CEUS, and the analysis could be revised with updated seismicity and model parameters. Consensus input models consider alternative earthquake catalog durations, smoothing parameters, maximum magnitudes, and ground motion estimates, and represent uncertainties...
Categories: Data;
Types: Downloadable,
GeoTIFF,
Map Service,
Raster;
Tags: Alabama,
Arizona,
Arkansas,
Colorado,
Connecticut,
This dataset contains values of normal reservoir storage in units of acre-feet per km2, for three time periods: 1992, 2002, and 2012. Values are derived from a slightly-modified version of the National Inventory of Dams (NID) 2013 dataset, for which approximately 10% of records had the dam completion date estimated.
Categories: Data;
Types: Citation;
Tags: Chesapeake Bay,
Delaware,
District of Columbia,
James River,
Maryland,
This data set represents the results of calculations of hazard curves for a grid of points with a spacing of 0.05 degrees in latitude and longitude. This particular data set is for horizontal spectral response acceleration for 1.0-second period with a 1 percent probability of exceedance in 1 year. The data are for the Central and Eastern United States and are based on the one-year model.
Categories: Data;
Types: Citation,
Downloadable,
Map Service,
OGC WFS Layer,
OGC WMS Layer,
Shapefile;
Tags: Alabama,
Arizona,
Arkansas,
Colorado,
Connecticut,
|

|
