Filters: Tags: Durham County (X)
91 results (97ms)|
Filters
Date Range
Types (Less) Contacts (Less)
Categories (Less) Tag Types Tag Schemes
|
The dataset contains the environmental data collected for the Triangle Area Water Supply Monitoring Project. The data are from the samples collected during routine and storm-runoff sampling events during October 2013 through September 2015. Several study sites contained in this dataset were sampled for other USGS projects during the same time frame. Unless the samples at these sites were collected in conjunction with the Triangle Area Water Supply Monitoring Project, the data for other projects at these sites are not included in this dataset.
The dataset contains the analytical results for quality-control samples collected during the surface-water sampling for the Triangle Area Water Supply Monitoring Project. The data are sampling-vehicle (ambient) blanks and field blanks collected during October 2013 through September 2015. Several study sites contained in this dataset were sampled for other USGS projects during the same time frame. Unless the quality-control samples at these sites were collected in conjunction with the Triangle Area Water Supply Monitoring Project, the data for other projects are not included in the dataset.
An initial reconnaissance survey in March 2016 and a subsequent survey in July 2016 was conducted to identify possible groundwater discharge points along the stream reach using a forward-looking infrared (FLIR) camera in seasonal extremes. The high-resolution thermal imaging camera captures the emitted infrared radiation of the objects in view. Recent studies using similar ground-based thermal infrared imaging techniques have been successful in qualitatively locating groundwater discharge along discrete features, such as fractures and faults, as well as diffuse seepage along stream banks (Deitchman and Loheide, 2009; Pandey and others, 2013). Sites of interest were those where temperature differences were observed...
The dataset contains the analytical results for environmental and quality-control replicate sample sets and the computed relative percent differences (RPD) greater than 25 percent for the data collected during the surface-water sampling for the Triangle Area Water Supply Monitoring Project. The data are from samples collected during October 2015 through September 2017. Several study sites contained in this dataset were sampled for other USGS projects during the same time frame. Unless the samples at these sites were collected in conjunction with the Triangle Area Water Supply Monitoring Project, the data for other projects are not included in the dataset.
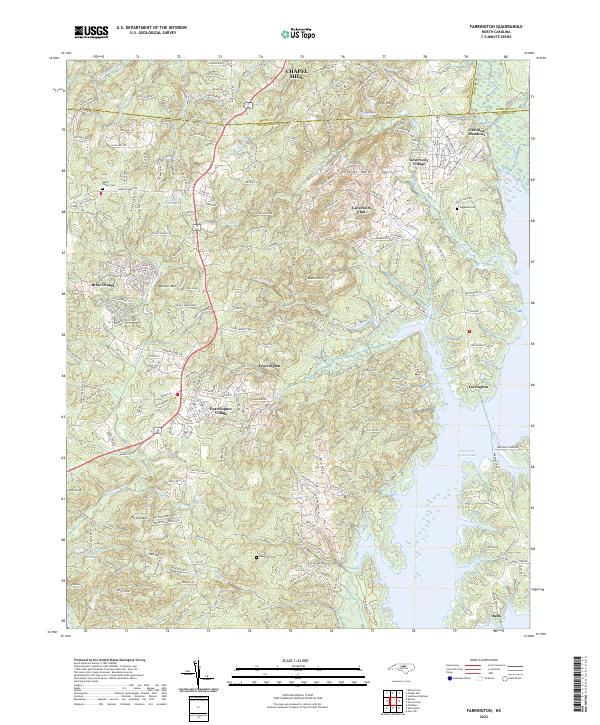
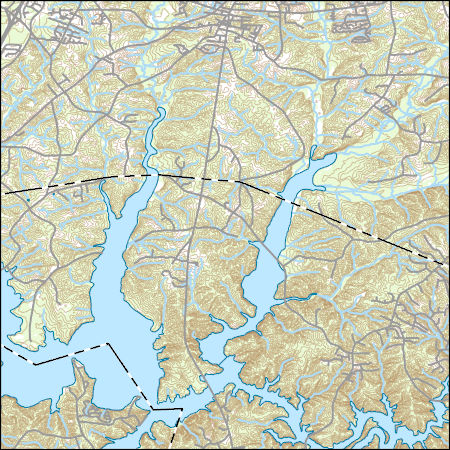
Layered geospatial PDF 7.5 Minute Quadrangle Map. Layers of geospatial data include orthoimagery, roads, grids, geographic names, elevation contours, hydrography, and other selected map features. This map is derived from GIS (geospatial information system) data. It represents a repackaging of GIS data in traditional map form, not creation of new information. The geospatial data in this map are from selected National Map data holdings and other government sources.
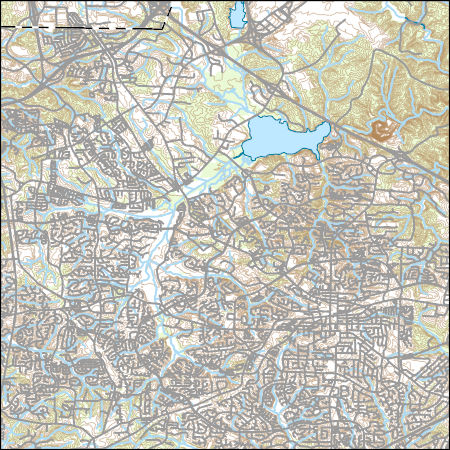
Layered geospatial PDF 7.5 Minute Quadrangle Map. Layers of geospatial data include orthoimagery, roads, grids, geographic names, elevation contours, hydrography, and other selected map features. This map is derived from GIS (geospatial information system) data. It represents a repackaging of GIS data in traditional map form, not creation of new information. The geospatial data in this map are from selected National Map data holdings and other government sources.
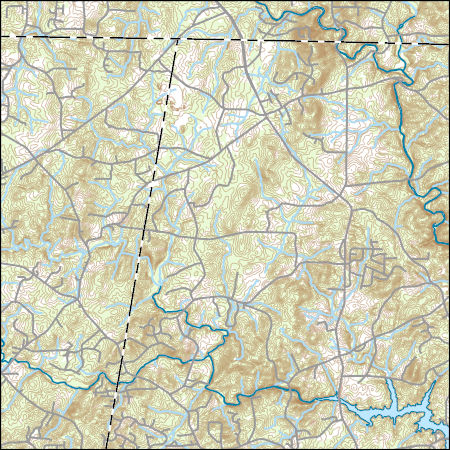
Layered geospatial PDF 7.5 Minute Quadrangle Map. Layers of geospatial data include orthoimagery, roads, grids, geographic names, elevation contours, hydrography, and other selected map features. This map is derived from GIS (geospatial information system) data. It represents a repackaging of GIS data in traditional map form, not creation of new information. The geospatial data in this map are from selected National Map data holdings and other government sources.

Layers of geospatial data include contours, boundaries, land cover, hydrography, roads, transportation, geographic names, structures, and other selected map features.
Types: Citation;
Tags: 7.5 x 7.5 minute,
7_5_Min,
Combined Vector,
Combined Vector,
Combined Vector,
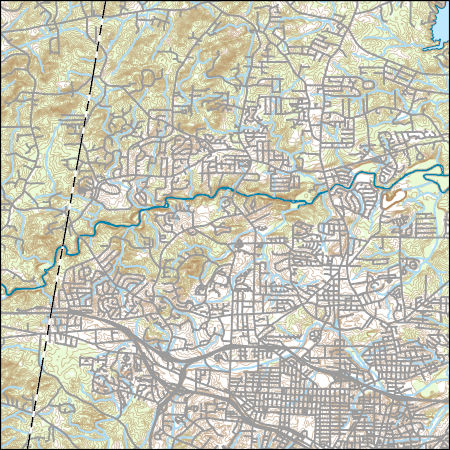
Layers of geospatial data include contours, boundaries, land cover, hydrography, roads, transportation, geographic names, structures, and other selected map features.
Types: Citation;
Tags: 7.5 x 7.5 minute,
7_5_Min,
Combined Vector,
Combined Vector,
Combined Vector,

Layers of geospatial data include contours, boundaries, land cover, hydrography, roads, transportation, geographic names, structures, and other selected map features.
Types: Citation;
Tags: 7.5 x 7.5 minute,
7_5_Min,
Combined Vector,
Combined Vector,
Combined Vector,
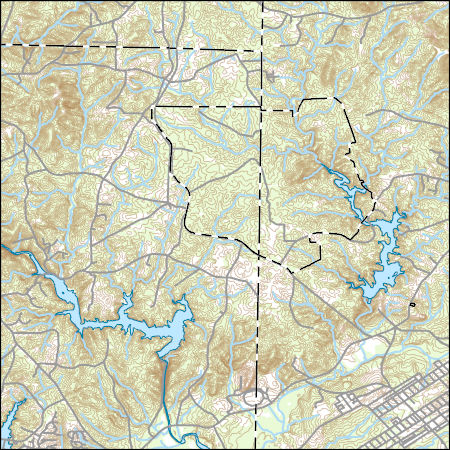
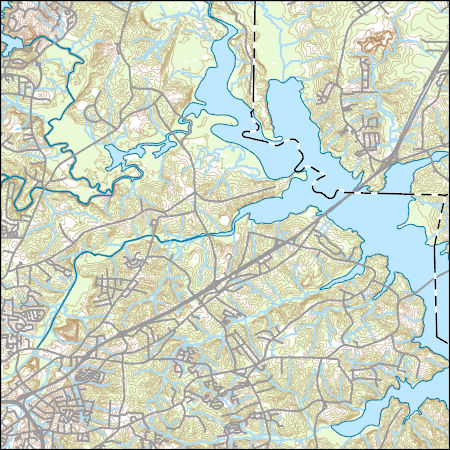
Layers of geospatial data include contours, boundaries, land cover, hydrography, roads, transportation, geographic names, structures, and other selected map features.
Types: Citation;
Tags: 7.5 x 7.5 minute,
7_5_Min,
Combined Vector,
Combined Vector,
Combined Vector,
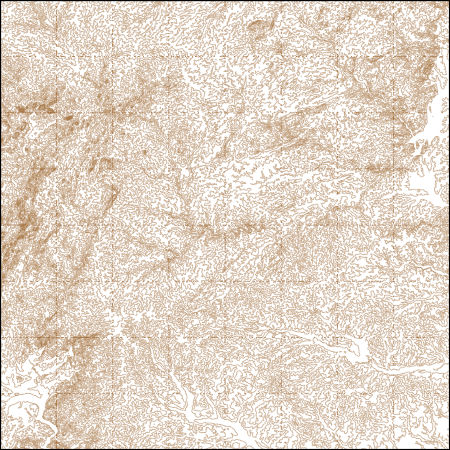
These vector contour lines are derived from the 3D Elevation Program using automated and semi-automated processes. They were created to support 1:24,000-scale CONUS and Hawaii, 1:25,000-scale Alaska, and 1:20,000-scale Puerto Rico / US Virgin Island topographic map products, but are also published in this GIS vector format. Contour intervals are assigned by 7.5-minute quadrangle, so this vector dataset is not visually seamless across quadrangle boundaries. The vector lines have elevation attributes (in feet above mean sea level on NAVD88), but this dataset does not carry line symbols or annotation.
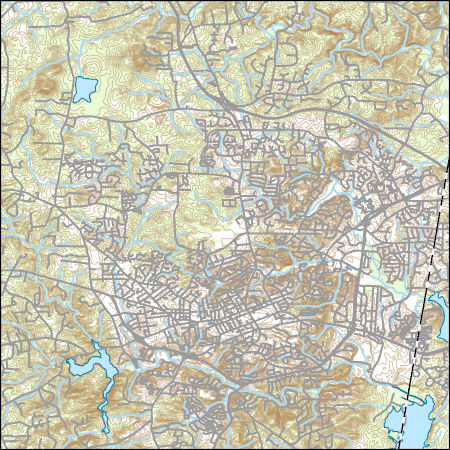
Layers of geospatial data include contours, boundaries, land cover, hydrography, roads, transportation, geographic names, structures, and other selected map features.
The dataset contains the analytical results for quality-control samples collected during the surface-water sampling for the Triangle Area Water Supply Monitoring Project. The data are equipment blanks, sampling-vehicle (ambient) blanks, and field blanks collected during October 2015 through September 2017. Several study sites contained in this dataset were sampled for other USGS projects during the same time frame. Unless the quality-control samples at these sites were collected in conjunction with the Triangle Area Water Supply Monitoring Project, the data for other projects are not included in the dataset.
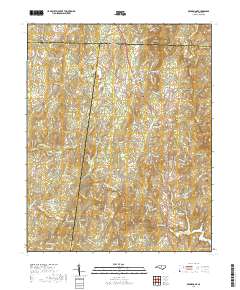
Layered geospatial PDF 7.5 Minute Quadrangle Map. Layers of geospatial data include orthoimagery, roads, grids, geographic names, elevation contours, hydrography, and other selected map features. This map is derived from GIS (geospatial information system) data. It represents a repackaging of GIS data in traditional map form, not creation of new information. The geospatial data in this map are from selected National Map data holdings and other government sources.

Layers of geospatial data include contours, boundaries, land cover, hydrography, roads, transportation, geographic names, structures, and other selected map features.
Types: Citation;
Tags: 7.5 x 7.5 minute,
7_5_Min,
Combined Vector,
Combined Vector,
Combined Vector,
Layers of geospatial data include contours, boundaries, land cover, hydrography, roads, transportation, geographic names, structures, and other selected map features.
Types: Citation;
Tags: 7.5 x 7.5 minute,
7_5_Min,
Combined Vector,
Combined Vector,
Combined Vector,
Layers of geospatial data include contours, boundaries, land cover, hydrography, roads, transportation, geographic names, structures, and other selected map features.
Layers of geospatial data include contours, boundaries, land cover, hydrography, roads, transportation, geographic names, structures, and other selected map features.
Layers of geospatial data include contours, boundaries, land cover, hydrography, roads, transportation, geographic names, structures, and other selected map features.
Types: Citation;
Tags: 7.5 x 7.5 minute,
7_5_Min,
Combined Vector,
Combined Vector,
Combined Vector,
|

|
