Filters: Tags: Forest health (X)
71 results (66ms)|
Filters
Date Range
Extensions (Less) Types (Less)
Contacts (Less)
Categories (Less) Tag Types
|

This dataset is a compilation of forest insect, disease and abiotic damage mapped by aerial detection surveys on forested areas in the United States. At this time, the National Aerial Survey Data Standards require only mortality and defoliation data be collected and reported. However, many cooperators collect data on other types of damage and therefore, the national database has been designed to accommodate these data. Low-level flights, typically 1,000 to 2,000 feet above ground level, are used to map forest damage. Observers use paper maps, typically 1:100,000 scale USGS maps, upon which they record the damage. There is also a digital sketchmap system that may be used. The digital system uses GPS to display the...
In the northern Colorado Front Range, fire suppression during the 20th century is believed to have created a high hazard of catastrophic fire in ponderosa pine (Pinus ponderosa) forests. Since the early 1990s, resource managers have increased the use of prescribed fires to re-create fire regimes and forest structures similar to those of the pre-Euro-American settlement period in order both to reduce fire hazard and to improve forest health. To improve understanding of historical fire regimes, we conducted a study of fire history along an elevational gradient from \sim1830 to 2800 m in ponderosa pine forests in the northern Front Range. Fire-scar dates were determined from 525 partial cross sections from living and...
Categories: Publication;
Types: Citation,
Journal Citation;
Tags: Colorado,
Ecological Applications,
Ecological Society of America,
El Nino-Southern Oscillation,
Pinus ponderosa.,

This dataset is a compilation of forest insect, disease and abiotic damage mapped by aerial detection surveys on forested areas in the United States. At this time, the National Aerial Survey Data Standards require only mortality and defoliation data be collected and reported. However, many cooperators collect data on other types of damage and therefore, the national database has been designed to accommodate these data. Low-level flights, typically 1,000 to 2,000 feet above ground level, are used to map forest damage. Observers use paper maps, typically 1:100,000 scale USGS maps, upon which they record the damage. There is also a digital sketchmap system that may be used. The digital system uses GPS to display the...
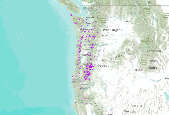
2010 USDA Forest Service, Rocky Mountain Region Aerial Detection Survey Data. This data depicts the occurrence and location of forest insect, disease, and other biotic and abiotic causes of tree mortality and tree damage. Aerial survey data is collected by observing areas of tree damage or tree mortality from an aircraft and manually recording the information onto a map. Due to the nature of aerial surveys, this data will only provide rough estimates of location, intensity and the resulting trend information for agents detectable from the air. Many of the most destructive diseases are not represented in the data because these agents are not detectable from aerial surveys. The data presented should only be used as...

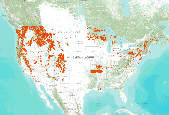
The 2006 National Insect and Disease Risk Map (NIDRM) Project integrates 188 individual risk models constructed within a common, consistent framework that accounts for regional variations in current and future forest health. The 2006 risk assessment, conducted within the contiguous United States and Alaska, provides a consistent, repeatable, transparent process through which interactive spatial and temporal risk assessments can be conducted at various scales to aid in the allocation of resources for forest health management. This modeling process is intended to increase the utilization of forest health risk maps within and outside the National Forest System and encourage development of future risk maps. NIDRM...
This dataset is a compilation of forest insect, disease and abiotic damage mapped by aerial detection surveys on forested areas in the United States. At this time, the National Aerial Survey Data Standards require only mortality and defoliation data be collected and reported. However, many cooperators collect data on other types of damage and therefore, the national database has been designed to accommodate these data. Low-level flights, typically 1,000 to 2,000 feet above ground level, are used to map forest damage. Observers use paper maps, typically 1:100,000 scale USGS maps, upon which they record the damage. There is also a digital sketchmap system that may be used. The digital system uses GPS to display the...
This dataset is a compilation of forest insect, disease and abiotic damage mapped by aerial detection surveys on forested areas in the United States. At this time, the National Aerial Survey Data Standards require only mortality and defoliation data be collected and reported. However, many cooperators collect data on other types of damage and therefore, the national database has been designed to accommodate these data. Low-level flights, typically 1,000 to 2,000 feet above ground level, are used to map forest damage. Observers use paper maps, typically 1:100,000 scale USGS maps, upon which they record the damage. There is also a digital sketchmap system that may be used. The digital system uses GPS to display the...

This dataset is a compilation of forest insect, disease and abiotic damage mapped by aerial detection surveys on forested areas in the United States. At this time, the National Aerial Survey Data Standards require only mortality and defoliation data be collected and reported. However, many cooperators collect data on other types of damage and therefore, the national database has been designed to accommodate these data. Low-level flights, typically 1,000 to 2,000 feet above ground level, are used to map forest damage. Observers use paper maps, typically 1:100,000 scale USGS maps, upon which they record the damage. There is also a digital sketchmap system that may be used. The digital system uses GPS to display the...

The acquisition of forest parameters by host species distributions is a significant factor in the identification of areas at risk of mortality to a particular agent. The most readily-available forest type maps do not contain enough location-specific information for insect and disease risk assessments, in particular species' age and stocking. Estimates for total and individual species' basal area (BA), quadratic mean diameter (QMD), stand density index (SDI), percent host composition, and predominant canopy position were developed for all 57 tree species and species groups modeled for the National Insect and Disease Risk Map. After extensively testing various interpolation methods, the Risk Map Integration Team...

The 2006 National Insect and Disease Risk Map (NIDRM) Project integrates 188 individual risk models constructed within a common, consistent framework that accounts for regional variations in current and future forest health. The 2006 risk map assessment, utilized within the contiguous United States and Alaska, provides a consistent, repeatable, transparent process through which interactive spatial and temporal risk assessments can be conducted at various scales to aid in the allocation of resources for forest health management. This modeling process is intended to increase the utilization of forest health risk maps within and outside the National Forest System and encourage development of future risk maps. NIDRM...
The Appalachian Trail (AT), a 14-state footpath from Maine to Georgia, is a unit of the National Park Service that is cooperatively managed and maintained by the National Park Service (NPS), the Appalachian Trail Conservancy, AT Club volunteers, the USDA Forest Service, and other public land-management agencies. Upper elevation and ridge-top ecosystems, which comprise much of the trail corridor, have been impacted by and remain extremely sensitive to acidic deposition. Ridgetop soils that are often low in calcium make the ecosystems of the AT more sensitive to acidic deposition than other ecosystems. Furthermore, upper elevations tend to receive the highest levels of deposition. In areas along the AT, such...
Categories: Data,
Project;
Types: Downloadable,
Map Service,
OGC WFS Layer,
OGC WMS Layer,
Shapefile;
Tags: Appalachian Trail,
Biogeochemical and Hydrologic Assessment,
BiogeochemicalandHydrologicAssessment,
Climate Impacts,
Completed,
This dataset is a compilation of forest insect, disease and abiotic damage mapped by aerial detection surveys on forested areas in the United States. At this time, the National Aerial Survey Data Standards require only mortality and defoliation data be collected and reported. However, many cooperators collect data on other types of damage and therefore, the national database has been designed to accommodate these data. Low-level flights, typically 1,000 to 2,000 feet above ground level, are used to map forest damage. Observers use paper maps, typically 1:100,000 scale USGS maps, upon which they record the damage. There is also a digital sketchmap system that may be used. The digital system uses GPS to display the...

The acquisition of host species distributions is a significant factor in the identification of areas at risk of mortality to a particular agent. The most readily-available forest type maps do not contain enough location-specific information for insect and disease risk assessments, in particular species' age and stocking. Estimates for total and individual species' basal area (BA), quadratic mean diameter (QMD), stand density index (SDI), percent host composition, and predominant canopy position were developed for all 57 tree species and species groups modeled for the National Insect and Disease Risk Map. After extensively testing various interpolation methods, the Risk Map Integration Team (RMIT) utilized a...

Two maps (PCT_BALOSS_AK - the ArcInfo Grid referenced to this metadata - and PCT_BALOSS - see accompanying CONUS Grid and its associated metadata) represent, in map form, the comprehensive version of the final results of the 2006 National Insect and Disease Risk Map (NIDRM) Project. Specifically, their pixel values range from 0 to 100 percent, representing the predicted percent of basal area loss over the next 15 years due to insects and diseases.
This is part of a 3-tiered dataset consisting ofIDS_shapes: footprint polygon featuresIDS_attrib: attribute descriptions of polygonsIDS_rollup: lookup information for features that are summarized as a group (rollup)This dataset is a compilation of forest insect, disease and abiotic damage mapped by aerial detection surveys on forested areas in the United States. At this time, the National Aerial Survey Data Standards require only mortality and defoliation data be collected and reported. However, many cooperators collect data on other types of damage and therefore, the national database has been designed to accommodate these data. Low-level flights, typically 1,000 to 2,000 feet above ground level, are used to map...
2010 USDA Forest Service, Rocky Mountain Region Aerial Detection Survey Data. This data depicts the occurrence and location of forest insect, disease, and other biotic and abiotic causes of tree mortality and tree damage. Aerial survey data is collected by observing areas of tree damage or tree mortality from an aircraft and manually recording the information onto a map. Due to the nature of aerial surveys, this data will only provide rough estimates of location, intensity and the resulting trend information for agents detectable from the air. Many of the most destructive diseases are not represented in the data because these agents are not detectable from aerial surveys. The data presented should only be used as...

This dataset is a compilation of forest insect, disease and abiotic damage mapped by aerial detection surveys on forested areas in the United States. At this time, the National Aerial Survey Data Standards require only mortality and defoliation data be collected and reported. However, many cooperators collect data on other types of damage and therefore, the national database has been designed to accommodate these data. Low-level flights, typically 1,000 to 2,000 feet above ground level, are used to map forest damage. Observers use paper maps, typically 1:100,000 scale USGS maps, upon which they record the damage. There is also a digital sketchmap system that may be used. The digital system uses GPS to display the...
These data were compiled in order to represent long-term (multi-decadal) forest growth across eight different experimental forests in the United States, each with replicated levels of density treatments, as well as an important drought index correlated to growth. Forests around the world are experiencing severe droughts and elevated competitive intensity due to increased tree density. These data can be utilized to not only examine differences in within-stand competition, as well the trends and impact of drought in different forests across a broad climatic gradient, but also the influence of interactions between drought and competition on forest growth. Growth is measured as a treatment level, annual basal area increment...
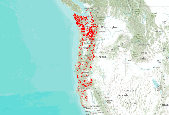
2010 USDA Forest Service, Rocky Mountain Region Aerial Detection Survey Data. This data depicts the occurrence and location of forest insect, disease, and other biotic and abiotic causes of tree mortality and tree damage. Aerial survey data is collected by observing areas of tree damage or tree mortality from an aircraft and manually recording the information onto a map. Due to the nature of aerial surveys, this data will only provide rough estimates of location, intensity and the resulting trend information for agents detectable from the air. Many of the most destructive diseases are not represented in the data because these agents are not detectable from aerial surveys. The data presented should only be used as...

This dataset is a compilation of forest insect, disease and abiotic damage mapped by aerial detection surveys on forested areas in the United States. At this time, the National Aerial Survey Data Standards require only mortality and defoliation data be collected and reported. However, many cooperators collect data on other types of damage and therefore, the national database has been designed to accommodate these data. Low-level flights, typically 1,000 to 2,000 feet above ground level, are used to map forest damage. Observers use paper maps, typically 1:100,000 scale USGS maps, upon which they record the damage. There is also a digital sketchmap system that may be used. The digital system uses GPS to display the...
|

|
