Filters: Tags: GCP LCC (X)
20 results (55ms)|
Filters
|
GCP LCC Focal Habitats created from the Texas Ecological Systems Map
Categories: Data;
Types: ArcGIS REST Map Service,
ArcGIS Service Definition,
Downloadable,
Map Service;
Tags: GCP LCC,
habitats,
vegetation
Gulf Coast Prairie LCC Broadly Defined Habitats created from the LANDFIRE Ecological Site Potential data.
Categories: Data;
Types: ArcGIS REST Map Service,
ArcGIS Service Definition,
Downloadable,
Map Service;
Tags: GCP LCC,
habitat
Percent Cultivated derived from the Cropland Data Layer Dataset by HUC 12
Categories: Data;
Types: ArcGIS REST Map Service,
ArcGIS Service Definition,
Downloadable,
Map Service;
Tags: cultivated,
gcp lcc

The SARP Flow Alteration Assessment provides a regional characterization of the distribution and risk of flow regime impairment of streams and rivers by anthropogenic sources at the NHD+ segment scale. This map illustrates the cumulative risk of flow alteration (RFA) from surface water use for thermopower generation in Oklahoma.  Water use is based on state permits for surface water withdrawals and returns.  The risk is based on the volume of water used monthly in the drainage area relative to the monthly volume of flow.  Risk of Flow Alteration categories:  ZERO     - 0% mean monthly flow depletion,  LOW      - > 0-10%,  MEDIUM - > 10-20%,  HIGH      - >20-100%, and  PROVISIONAL...
Comprehensive geospatial data covering the area of the Gulf Coast Prairie Landscape Conservation Cooperative is needed to better inform and improve countless conservation efforts and help partners convey a shared vision and priorities for this area in geospatial terms.
Categories: Data,
Project;
Types: Map Service,
OGC WFS Layer,
OGC WMS Layer,
OGC WMS Service;
Tags: 2013,
2016,
2017,
Academics & scientific researchers,
Applications and Tools,

The SARP Flow Alteration Assessment provides a regional characterization of the distribution and risk of flow regime impairment of streams and rivers by anthropogenic sources at the NHD+ segment scale. This map illustrates the cumulative risk of flow alteration (RFA) from surface water use industrial water use in Texas and Oklahoma.  Water use is based on state permits for surface water withdrawals and returns.  The risk is based on the volume of water used monthly in the drainage area relative to the monthly volume of flow.  Risk of Flow Alteration categories:  ZERO     - 0% mean monthly flow depletion,  LOW      - > 0-10%,  MEDIUM - > 10-20%,  HIGH      - >20-100%, and Â...
Percent Urban Area, derived from the 2011 National Landcover Dataset by HUC 12
Categories: Data;
Types: ArcGIS REST Map Service,
ArcGIS Service Definition,
Downloadable,
Map Service;
Tags: GCP LCC,
Urban

The SARP Flow Alteration Assessment provides a regional characterization of the distribution and risk of flow regime impairment of streams and rivers by anthropogenic sources at the NHD+ segment scale. This map illustrates the local risk of flow alteration (RFA) from surface water use by water use sector for Texas and Oklahoma.  Water use is based on state permits for surface water withdrawals and returns.  The risk is based on the volume of water used monthly in the drainage area relative to the monthly volume of flow.  Risk of Flow Alteration categories:  ZERO     - 0% mean monthly flow depletion,  LOW      - > 0-10%,  MEDIUM - > 10-20%,  HIGH      - >20-100%, and  PROVISIONAL...

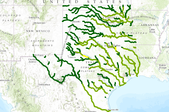
The SARP Flow Alteration Assessment provides a regional characterization of the distribution and risk of flow regime impairment of streams and rivers by anthropogenic sources at the NHD+ segment scale. This map illustrates the risk of flow alteration (RFA) due to evaporative loss from artificial water bodies in local catchments for the 14-state SARP region. Â The amount of water body surface is based on high resolution NHD and linked to NHD+ catchments. Â The risk is based on the percentage of the catchment land surface covered by artificial water bodies (100 x water body surface area / watershed surface area) Risk of flow alteration categories: Â Â Â Â Â Â Â Â Â ZERO -Â Â Â Â Â Â 0% land covered by artificial...
The SARP Flow Alteration Assessment provides a regional characterization of the distribution and risk of flow regime impairment of streams and rivers by anthropogenic sources at the NHD+ segment scale. This map illustrates the cumulative risk of flow alteration (RFA) from surface water use for mining in Texas and Oklahoma.  Water use is based on state permits for surface water withdrawals and returns.  The risk is based on the volume of water used monthly in the drainage area relative to the monthly volume of flow.  Risk of Flow Alteration categories:  ZERO     - 0% mean monthly flow depletion,  LOW      - > 0-10%,  MEDIUM - > 10-20%,  HIGH      - >20-100%, and  PROVISIONAL...

The SARP Flow Alteration Assessment provides a regional characterization of the distribution and risk of flow regime impairment of streams and rivers by anthropogenic sources at the NHD+ segment scale. This map illustrates the cumulative risk of flow alteration (RFA) from surface water use for domestic and livestock in Texas and Oklahoma.  Water use is based on state permits for surface water withdrawals and returns.  The risk is based on the volume of water used monthly in the drainage area relative to the monthly volume of flow.  Risk of Flow Alteration categories:  ZERO     - 0% mean monthly flow depletion,  LOW      - > 0-10%,  MEDIUM - > 10-20%,  HIGH      - >20-100%,...
Percent Urban Area derived from the 2011 National Landcover Dataset by Catchments
Categories: Data;
Types: ArcGIS REST Map Service,
ArcGIS Service Definition,
Downloadable,
Map Service;
Tags: GCP LCC,
Urban

The SARP Flow Alteration Assessment provides a regional characterization of the distribution and risk of flow regime impairment of streams and rivers by anthropogenic sources at the NHD+ segment scale. This map illustrates the risk of flow alteration (RFA) from runoff from impervious surfaces in local catchments for the 14-state SARP region.  The amount of impervious surface is based on 2006 National Land Use/Land Cover dataset.  The risk is based on the percentage of the catchment land surface covered by impervious surfaces (100 x impervious surface area / watershed surface area: Risk of flow alteration categories:         ZERO -     0% land covered by impervious surface         LOW -Â...
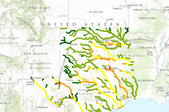
The SARP Flow Alteration Assessment provides a regional characterization of the distribution and risk of flow regime impairment of streams and rivers by anthropogenic sources at the NHD+ segment scale. This map illustrates the cumulative risk of flow alteration (RFA) from surface water use by water use sector for Texas and Oklahoma.  Water use is based on state permits for surface water withdrawals and returns.  The risk is based on the volume of water used monthly in the drainage area relative to the monthly volume of flow.Risk of Flow Alteration categories: ZERO     - 0% mean monthly flow depletion,  LOW      - > 0-10%,  MEDIUM - > 10-20%,  HIGH      - >20-100%, and PROVISIONAL...

The SARP Flow Alteration Assessment provides a regional characterization of the distribution and risk of flow regime impairment of streams and rivers by anthropogenic sources at the NHD+ segment scale. This map illustrates the cumulative risk of flow alteration (RFA) from surface water use for municipalities in Texas and Oklahoma.  Water use is based on state permits for surface water withdrawals and returns.  The risk is based on the volume of water used monthly in the drainage area relative to the monthly volume of flow.  Risk of Flow Alteration categories:  ZERO     - 0% mean monthly flow depletion,  LOW      - > 0-10%,  MEDIUM - > 10-20%,  HIGH      - >20-100%, and  PROVISIONAL...
GCP LCC Percent Cultivated Area by catchment (CDL 13) - DRAFT
Categories: Data;
Types: ArcGIS REST Map Service,
ArcGIS Service Definition,
Downloadable,
Map Service;
Tags: cultivated,
gcp lcc

The SARP Flow Alteration Assessment provides a regional characterization of the distribution and risk of flow regime impairment of streams and rivers by anthropogenic sources at the NHD+ segment scale. This map illustrates the cumulative risk of flow alteration (RFA) from surface water use for irrigation in Texas and Oklahoma.  Water use is based on state permits for surface water withdrawals and returns.  The risk is based on the volume of water used monthly in the drainage area relative to the monthly volume of flow.  Risk of Flow Alteration categories:  ZERO     - 0% mean monthly flow depletion,  LOW      - > 0-10%,  MEDIUM - > 10-20%,  HIGH      - >20-100%, and  PROVISIONAL...

The SARP Flow Alteration Assessment provides a regional characterization of the distribution and risk of flow regime impairment by anthropogenic sources at the NHD+ segment scale. This map illustrates the annual risk of impacts to flow from evaporative loss from artificial waterbodies within the whole watershed. The cumulative risk is based on the percent of the land surface in the watershed covered by artificial water bodies (100 x water body surface area / watershed surface area) Risk categories:   ZERO -      0% land covered by artificial water bodies,                             LOW -      0-2%                            MEDIUM -Â...
Percent Tidal Wetlands derived from the National Wetlands Inventory Dataset by HUC 12
Categories: Data;
Types: ArcGIS REST Map Service,
ArcGIS Service Definition,
Downloadable,
Map Service;
Tags: GCP LCC,
tidal marsh

The SARP Flow Alteration Assessment provides a regional characterization of the distribution and risk of flow regime impairment of streams and rivers by anthropogenic sources at the NHD+ segment scale. This map illustrates the cumulative risk of flow alteration (RFA) due to runoff from impervious surfaces for the 14-state SARP region. Â The amount of impervious surface is based on 2006 National Land Use/Land Cover dataset. Â The risk is based on the percentage of the catchment land surface covered by impervious surfaces (100 x impervious surface area / watershed surface area): Risk of flow alteration categories: Â Â Â Â Â Â Â Â Â Â Â Â Â Â Â Â Â Â Â Â Â Â Â Â Â Â Â ZERO -Â Â Â Â Â 0% land covered by impervious...
|

|
