Filters: Tags: Geospatial Analysis (X)
808 results (24ms)|
Filters
Date Range
Extensions Types Contacts
Categories
Tag Types
|
Understanding how sea-level rise will affect coastal landforms and the species and habitats they support is critical for crafting approaches that balance the needs of humans and native species. Given this increasing need to forecast sea-level rise effects on barrier islands in the near and long terms, we are developing Bayesian networks to evaluate and to forecast the cascading effects of sea-level rise on shoreline change, barrier island state, and piping plover habitat availability. We use publicly available data products, such as lidar, orthophotography, and geomorphic feature sets derived from those, to extract metrics of barrier island characteristics at consistent sampling distances. The metrics are then incorporated...
Categories: Data;
Types: Downloadable,
GeoTIFF,
Map Service,
Raster;
Tags: Atlantic Ocean,
Barrier Island,
CMGP,
Cedar Island,
Cedar Island,
Understanding how sea-level rise will affect coastal landforms and the species and habitats they support is critical for crafting approaches that balance the needs of humans and native species. Given this increasing need to forecast sea-level rise effects on barrier islands in the near and long terms, we are developing Bayesian networks to evaluate and to forecast the cascading effects of sea-level rise on shoreline change, barrier island state, and piping plover habitat availability. We use publicly available data products, such as lidar, orthophotography, and geomorphic feature sets derived from those, to extract metrics of barrier island characteristics at consistent sampling distances. The metrics are then incorporated...
Categories: Data;
Types: Downloadable,
GeoTIFF,
Map Service,
Raster;
Tags: Atlantic Ocean,
Barrier Island,
Bayesian Network,
CMGP,
Charadrius melodus,
Understanding how sea-level rise will affect coastal landforms and the species and habitats they support is critical for crafting approaches that balance the needs of humans and native species. Given this increasing need to forecast sea-level rise effects on barrier islands in the near and long terms, we are developing Bayesian networks to evaluate and to forecast the cascading effects of sea-level rise on shoreline change, barrier island state, and piping plover habitat availability. We use publicly available data products, such as lidar, orthophotography, and geomorphic feature sets derived from those, to extract metrics of barrier island characteristics at consistent sampling distances. The metrics are then incorporated...
Categories: Data;
Types: Downloadable,
GeoTIFF,
Map Service,
Raster;
Tags: Atlantic Ocean,
Barrier Island,
CMGP,
Coastal Habitat,
Coastal and Marine Geology Program,
Understanding how sea-level rise will affect coastal landforms and the species and habitats they support is critical for crafting approaches that balance the needs of humans and native species. Given this increasing need to forecast sea-level rise effects on barrier islands in the near and long terms, we are developing Bayesian networks to evaluate and to forecast the cascading effects of sea-level rise on shoreline change, barrier island state, and piping plover habitat availability. We use publicly available data products, such as lidar, orthophotography, and geomorphic feature sets derived from those, to extract metrics of barrier island characteristics at consistent sampling distances. The metrics are then incorporated...
Categories: Data;
Types: Downloadable,
GeoTIFF,
Map Service,
Raster;
Tags: Atlantic Ocean,
CMGP,
Coastal Habitat,
Coastal and Marine Geology Program,
Edwin B. Forsythe NWR,
Understanding how sea-level rise will affect coastal landforms and the species and habitats they support is critical for crafting approaches that balance the needs of humans and native species. Given this increasing need to forecast sea-level rise effects on barrier islands in the near and long terms, we are developing Bayesian networks to evaluate and to forecast the cascading effects of sea-level rise on shoreline change, barrier island state, and piping plover habitat availability. We use publicly available data products, such as lidar, orthophotography, and geomorphic feature sets derived from those, to extract metrics of barrier island characteristics at consistent sampling distances. The metrics are then incorporated...
Categories: Data;
Types: Downloadable,
GeoTIFF,
Map Service,
OGC WFS Layer,
OGC WMS Layer,
Raster,
Shapefile;
Tags: Atlantic Ocean,
Barrier Island,
Bayesian Network,
CMGP,
Coastal Erosion,
Understanding how sea-level rise will affect coastal landforms and the species and habitats they support is critical for crafting approaches that balance the needs of humans and native species. Given this increasing need to forecast sea-level rise effects on barrier islands in the near and long terms, we are developing Bayesian networks to evaluate and to forecast the cascading effects of sea-level rise on shoreline change, barrier island state, and piping plover habitat availability. We use publicly available data products, such as lidar, orthophotography, and geomorphic feature sets derived from those, to extract metrics of barrier island characteristics at consistent sampling distances. The metrics are then incorporated...
Categories: Data;
Types: Downloadable,
GeoTIFF,
Map Service,
Raster;
Tags: Atlantic Ocean,
CMGP,
Coastal Habitat,
Coastal and Marine Geology Program,
Edwin B. Forsythe NWR,
Understanding how sea-level rise will affect coastal landforms and the species and habitats they support is critical for crafting approaches that balance the needs of humans and native species. Given this increasing need to forecast sea-level rise effects on barrier islands in the near and long terms, we are developing Bayesian networks to evaluate and to forecast the cascading effects of sea-level rise on shoreline change, barrier island state, and piping plover habitat availability. We use publicly available data products, such as lidar, orthophotography, and geomorphic feature sets derived from those, to extract metrics of barrier island characteristics at consistent sampling distances. The metrics are then incorporated...
Categories: Data;
Types: Downloadable,
GeoTIFF,
Map Service,
Raster;
Tags: Atlantic Ocean,
Barrier Island,
CMGP,
Coastal Habitat,
Coastal and Marine Geology Program,
These data identify the time (0-1 min, 1-2 min,or 2-3 min) and distance (≤50 meters, >50 meters) category when birds were first detected during 3-minutes point counts at stop locations associated with North American Breeding Bird Survey routes or route equivalents that were surveyed on dates between 2009 and 2016 and provide point location coordinates of stop locations along North American Breeding Bird Survey routes or route equivalents within (or within 60 miles) the Gulf Coastal Plains & Ozarks Landscape Conservation Cooperative boundary.
The High Plains aquifer extends from approximately 32 to 44 degrees north latitude and 96 degrees 30 minutes to 106 degrees west longitude. The aquifer underlies about 175,000 square miles in parts of Colorado, Kansas, Nebraska, New Mexico, Oklahoma, South Dakota, Texas, and Wyoming. This digital dataset consists of a raster of water-level changes for the High Plains aquifer, predevelopment (about 1950) to 2019. It was created using water-level measurements from 2,741 wells measured in both the predevelopment period (about 1950) and in 2019, the latest available static water level measured in 2015 to 2018 from 71 wells in New Mexico and using other published information on water-level change in areas with few water-level...
These data include 217 median groundwater elevations computed from compiled measurements made in the year 2010 within the transboundary Mesilla/Conejos-Médanos Basin, United States and Mexico, along with their corresponding interpolated groundwater elevations and standard errors from the application of kriging. Of the 217 median groundwater elevation locations, 109 were in the United States and 108 were in Mexico. Considered measurements were limited to wells thought to be completed in the basin-fill/Santa Fe Group aquifer based on well records. This dataset includes a comma-separated values file (Control_points.csv) that provides the median groundwater elevations that were kriged to yield rasters of estimated groundwater...
Categories: Data;
Types: Downloadable,
GeoTIFF,
Map Service,
Raster;
Tags: Chihuahua (state),
Dona Ana county (county),
Hydrology,
New Mexico (state),
Texas (state),
Digital flood-inundation maps for a 3.4-mile reach of Fourmile Creek at Silver Grove, Kentucky (Ky.), were created by the U.S. Geological Survey (USGS) in cooperation with the City of Silver Grove and the U.S. Army Corps of Engineers Louisville District. Because the City of Silver Grove is subject to flooding from Fourmile Creek and the Ohio River (backwater flooding up Fourmile Creek), a set of flood-inundation maps was created for each flooding source independently and for combinations of possible flooding scenarios. The flood-inundation maps depict estimates of the areal extent and depth of flooding corresponding to a range of different gage heights (gage height is commonly referred to as “stage,” or the water-surface...
This dataset contains a thematic [classified] image derived from supervised classification of WorldView-3 satellite imagery. This data release contains a geospatial thematic (raster) image derived from a supervised classification of WorldView-3 satellite imagery obtained during 2020–21. Arundo donax (Arundo cane, giant reed, or Carrizo cane), is an invasive bamboo-like perennial grass most common to riparian areas throughout the southwestern United States. Because it displaces native riparian vegetation, Arundo cane has greatly disrupted the health of riparian ecosystems in the southwestern United States and northern Mexico during the past 50 years. Arundo cane also has created border security problems along the...
Types: Map Service,
OGC WFS Layer,
OGC WMS Layer,
OGC WMS Service;
Tags: Arundo cane,
Arundo donax,
Carrizo cane,
Giant Reed,
Rio Grande,
Well-established conservation planning principles and techniques framed by geodesign were used to assess the restorability of areas that historically supported coastal wetlands along the U.S. shore of Saginaw Bay. The resulting analysis supported planning efforts to identify, prioritize, and track wetland restoration opportunity and investment in the region. To accomplish this, publicly available data, criteria derived from the regional managers and local stakeholders, and geospatial analysis were used to form an ecological model for spatial prioritization.
A high-resolution raster dataset of simulated maximum tsunami elevations in Half Moon Bay, California, based on the Science Application for Risk Reduction (SAFRR) tsunami scenario
Categories: Data;
Types: Downloadable,
GeoTIFF,
Map Service,
Raster;
Tags: CMHRP,
Coastal and Marine Hazards and Resources Program,
Half Moon Bay,
PCMSC,
Pacific Coastal and Marine Science Center,

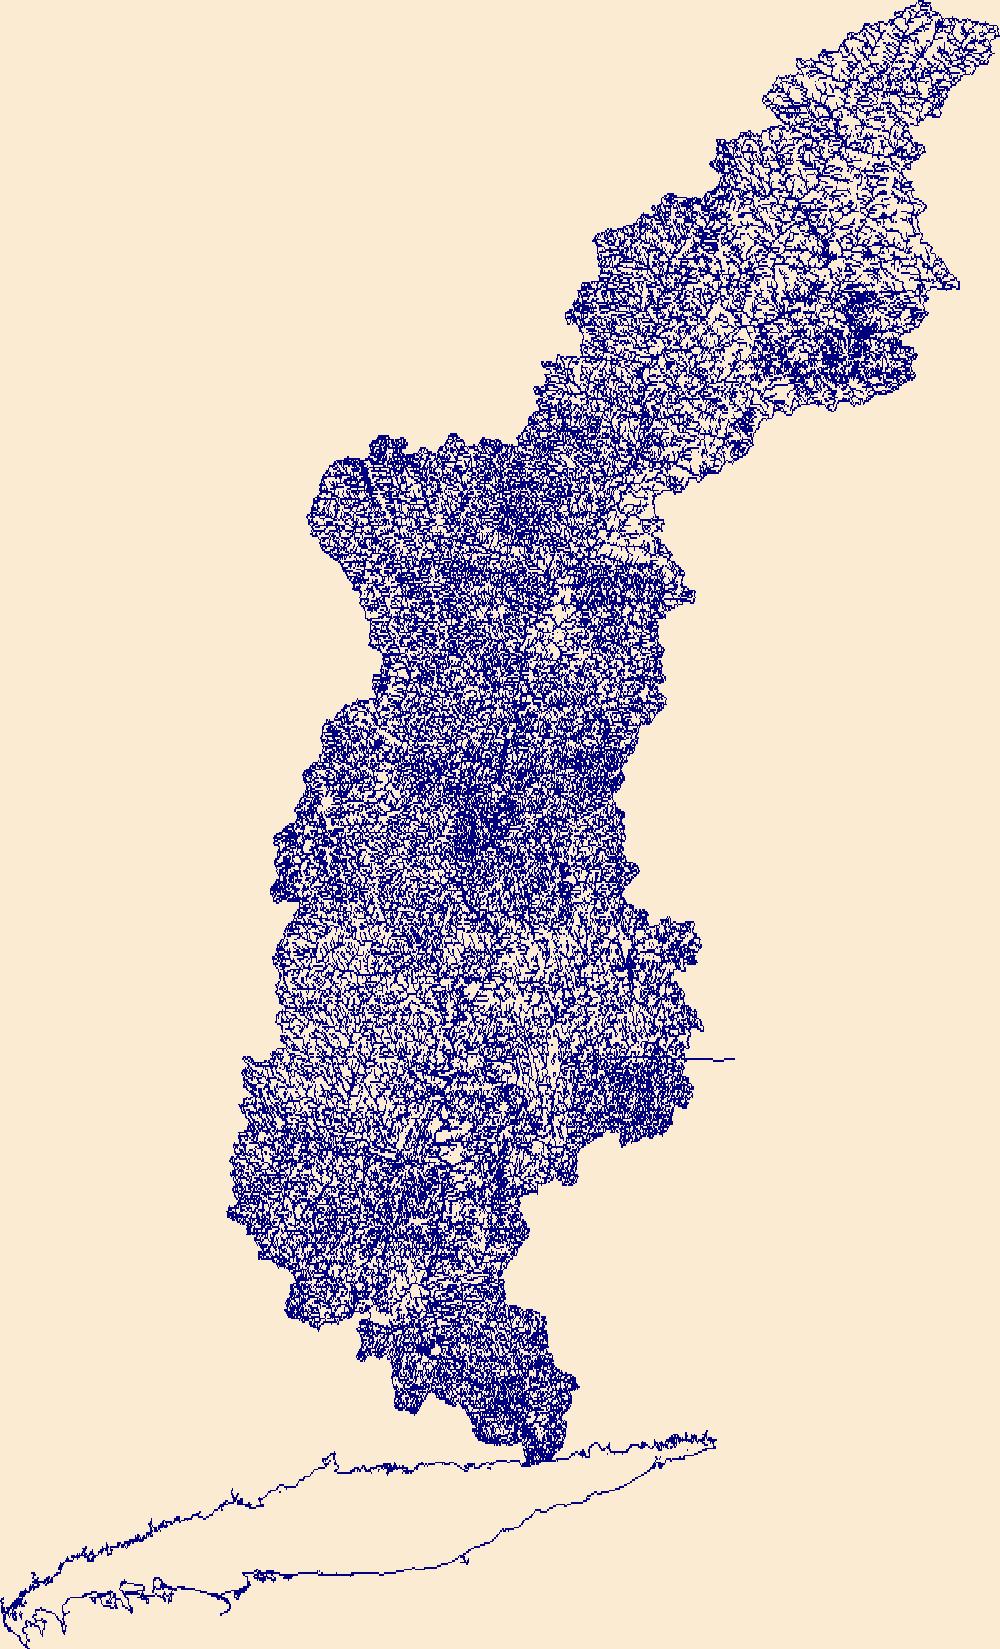
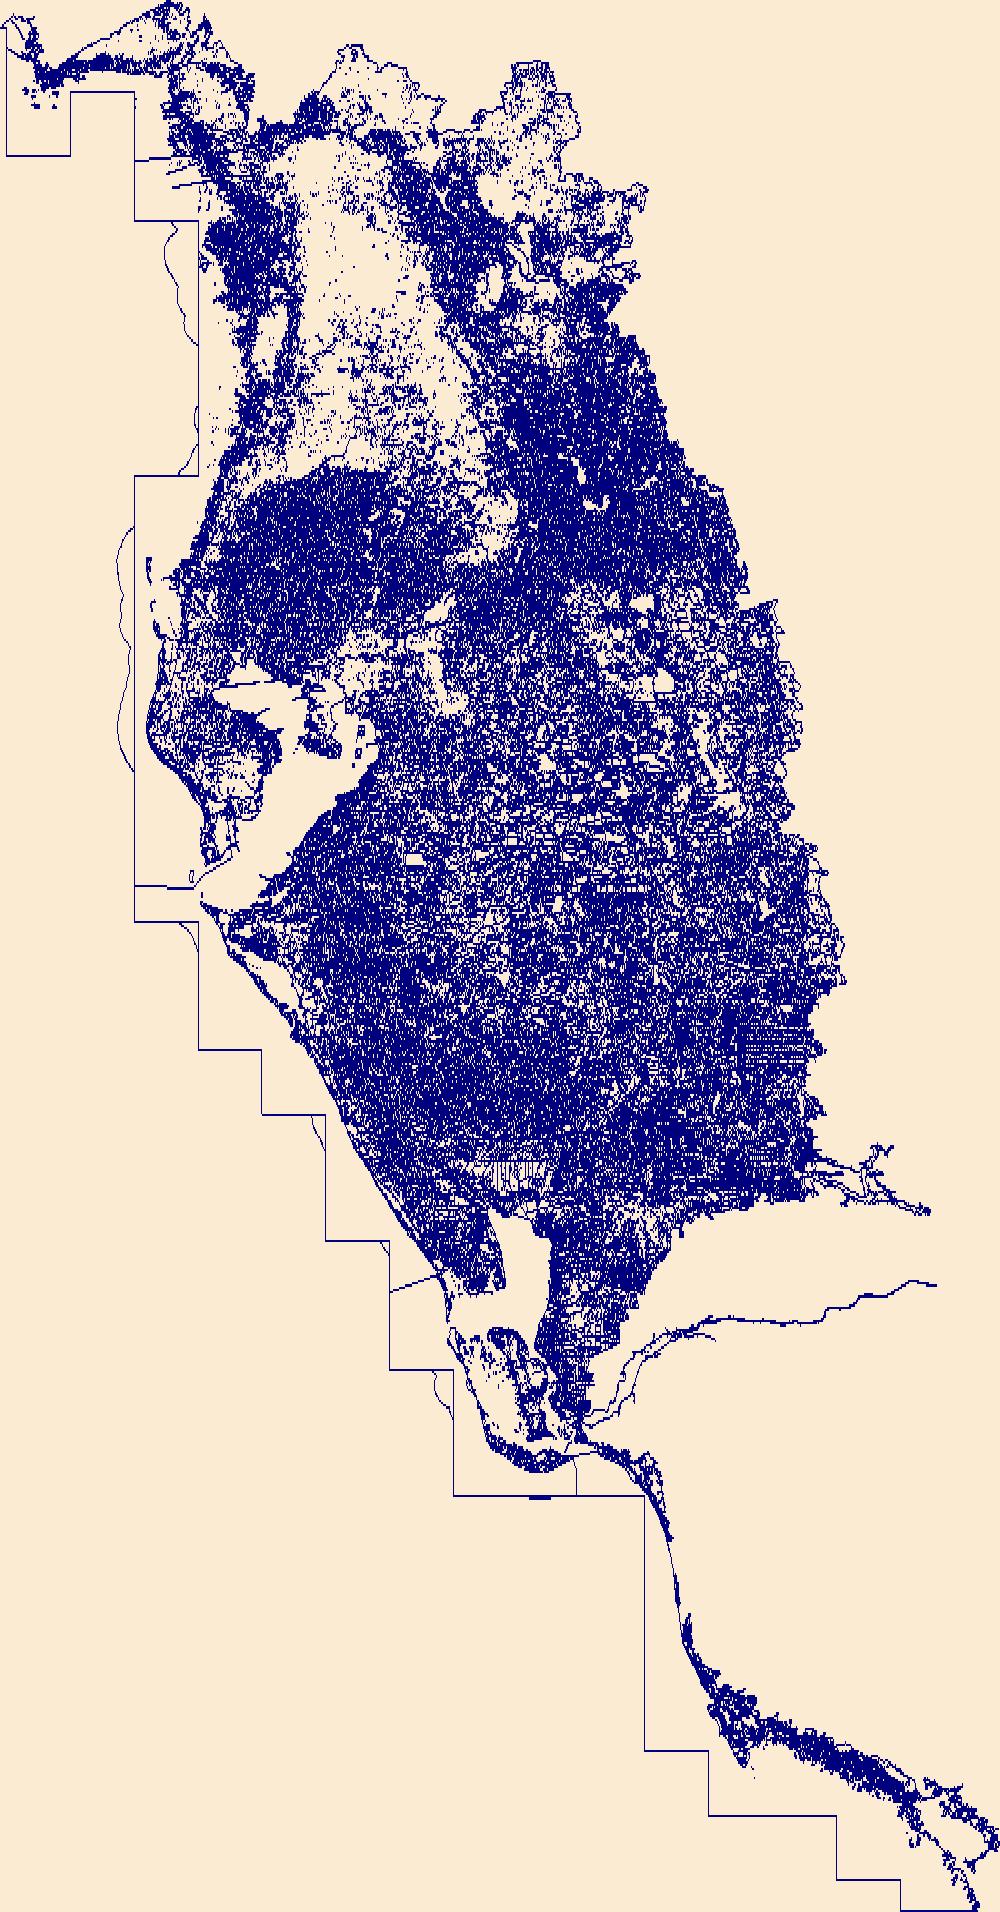
The High Resolution National Hydrography Dataset Plus (NHDPlus HR) is an integrated set of geospatial data layers, including the National Hydrography Dataset (NHD), National Watershed Boundary Dataset (WBD), and 3D Elevation Program Digital Elevation Model (3DEP DEM). The NHDPlus HR combines the NHD, 3DEP DEMs, and WBD to a data suite that includes the NHD stream network with linear referencing functionality, the WBD hydrologic units, elevation-derived catchment areas for each stream segment, "value added attributes" (VAAs), and other features that enhance hydrologic data analysis and routing.

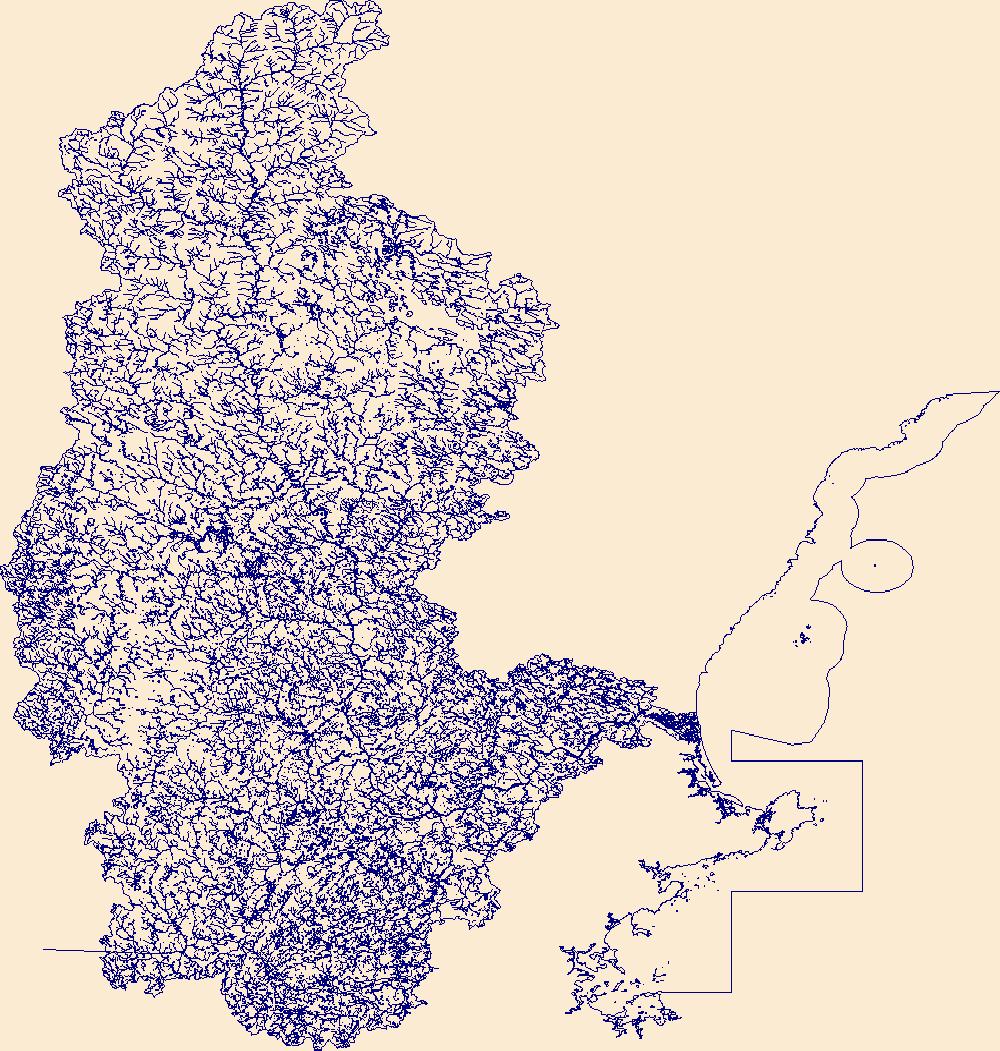
The High Resolution National Hydrography Dataset Plus (NHDPlus HR) is an integrated set of geospatial data layers, including the best available National Hydrography Dataset (NHD), the 10-meter 3D Elevation Program Digital Elevation Model (3DEP DEM), and the National Watershed Boundary Dataset (WBD). The NHDPlus HR combines the NHD, 3DEP DEMs, and WBD to create a stream network with linear referencing, feature naming, "value added attributes" (VAAs), elevation-derived catchments, and other features for hydrologic data analysis. The stream network with linear referencing is a system of data relationships applied to hydrographic systems so that one stream reach "flows" into another and "events" can be tied to and traced...

The High Resolution National Hydrography Dataset Plus (NHDPlus HR) is an integrated set of geospatial data layers, including the National Hydrography Dataset (NHD), National Watershed Boundary Dataset (WBD), and 3D Elevation Program Digital Elevation Model (3DEP DEM). The NHDPlus HR combines the NHD, 3DEP DEMs, and WBD to a data suite that includes the NHD stream network with linear referencing functionality, the WBD hydrologic units, elevation-derived catchment areas for each stream segment, "value added attributes" (VAAs), and other features that enhance hydrologic data analysis and routing.

The High Resolution National Hydrography Dataset Plus (NHDPlus HR) is an integrated set of geospatial data layers, including the best available National Hydrography Dataset (NHD), the 10-meter 3D Elevation Program Digital Elevation Model (3DEP DEM), and the National Watershed Boundary Dataset (WBD). The NHDPlus HR combines the NHD, 3DEP DEMs, and WBD to create a stream network with linear referencing, feature naming, "value added attributes" (VAAs), elevation-derived catchments, and other features for hydrologic data analysis. The stream network with linear referencing is a system of data relationships applied to hydrographic systems so that one stream reach "flows" into another and "events" can be tied to and traced...
|

|