Filters: Tags: Grays Harbor County (X)
136 results (42ms)|
Filters
Date Range
Types (Less) Contacts (Less)
Categories (Less) Tag Types Tag Schemes
|
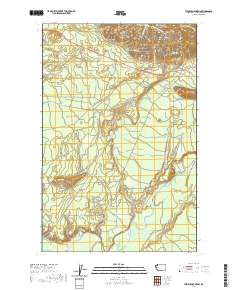
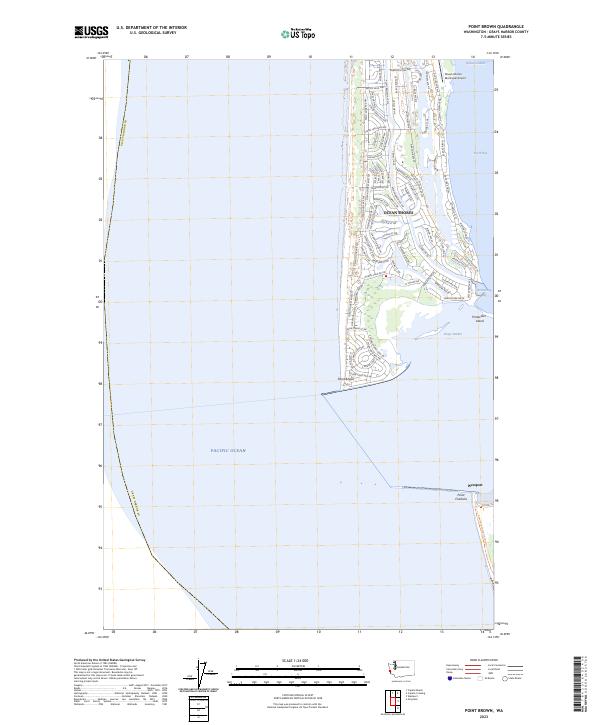
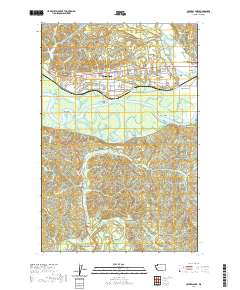
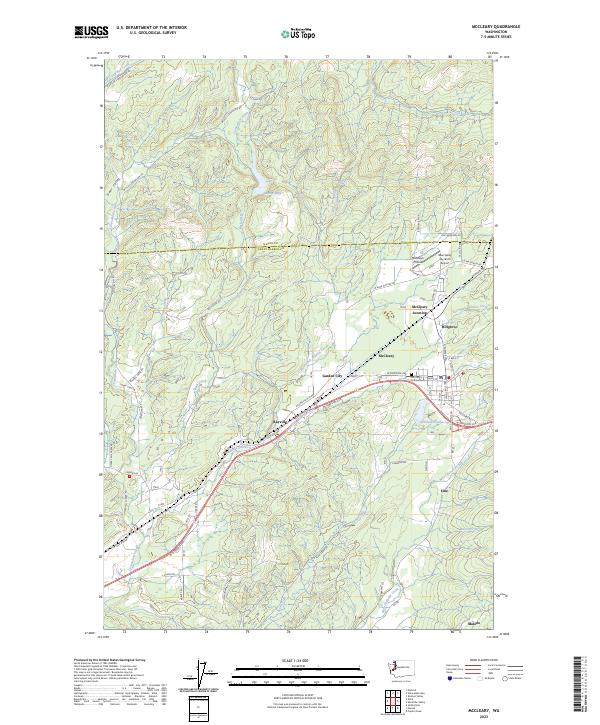
Layered geospatial PDF 7.5 Minute Quadrangle Map. Layers of geospatial data include orthoimagery, roads, grids, geographic names, elevation contours, hydrography, and other selected map features. This map is derived from GIS (geospatial information system) data. It represents a repackaging of GIS data in traditional map form, not creation of new information. The geospatial data in this map are from selected National Map data holdings and other government sources.
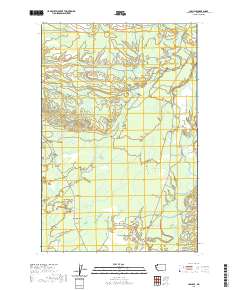
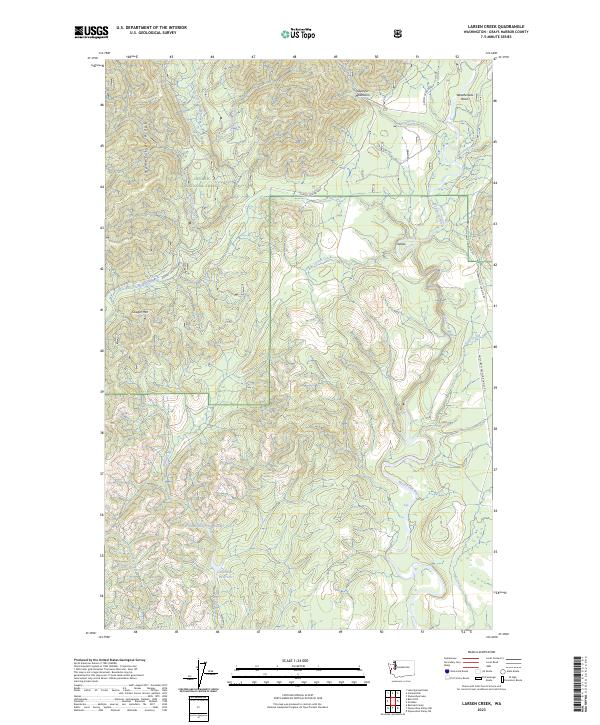
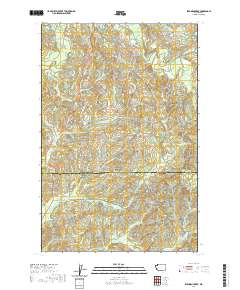
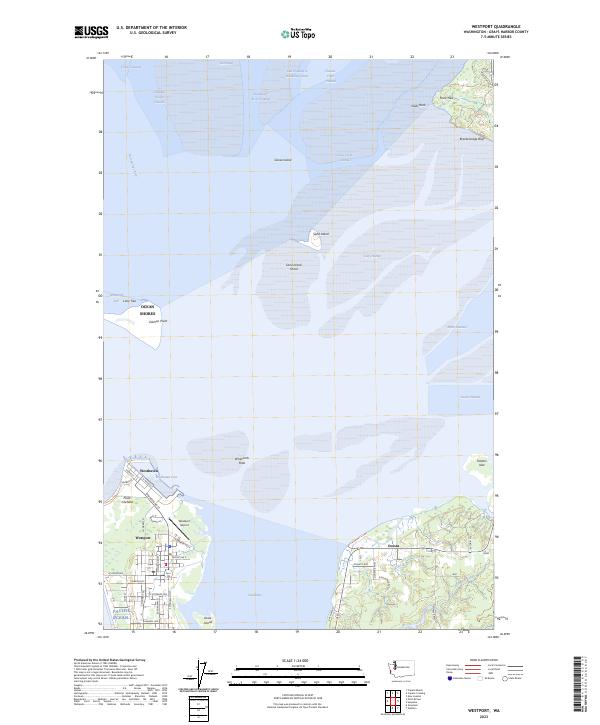
Layered geospatial PDF 7.5 Minute Quadrangle Map. Layers of geospatial data include orthoimagery, roads, grids, geographic names, elevation contours, hydrography, and other selected map features. This map is derived from GIS (geospatial information system) data. It represents a repackaging of GIS data in traditional map form, not creation of new information. The geospatial data in this map are from selected National Map data holdings and other government sources.
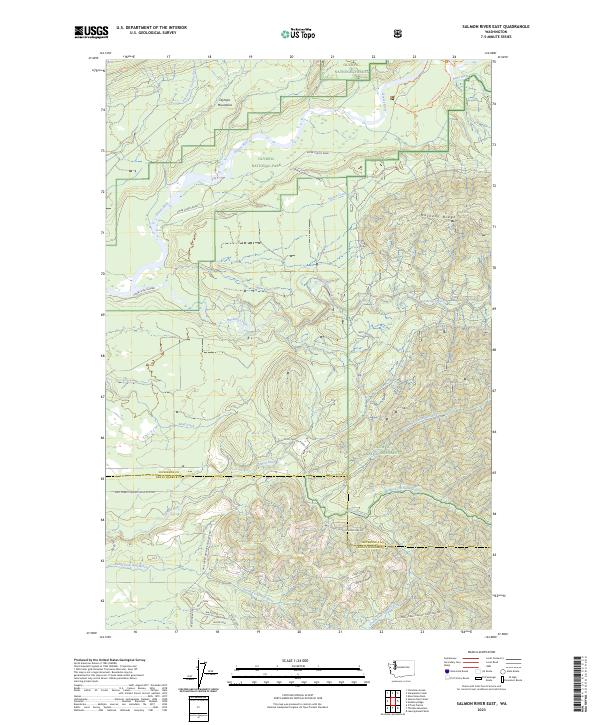
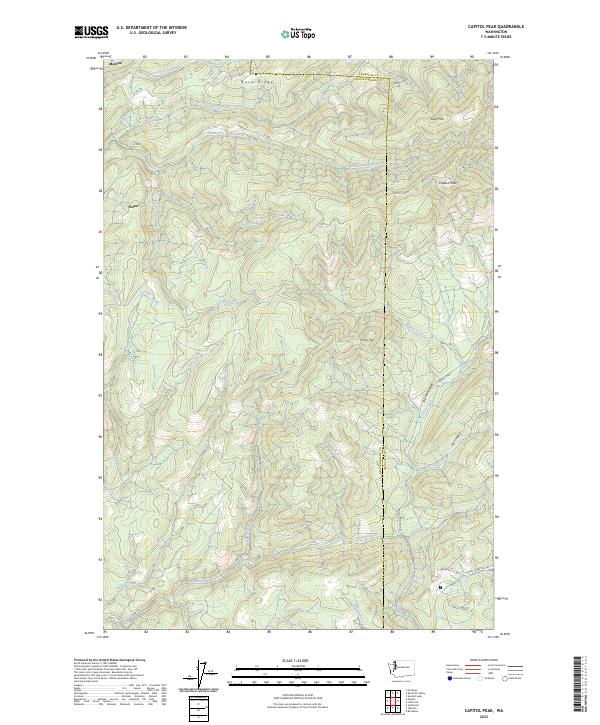
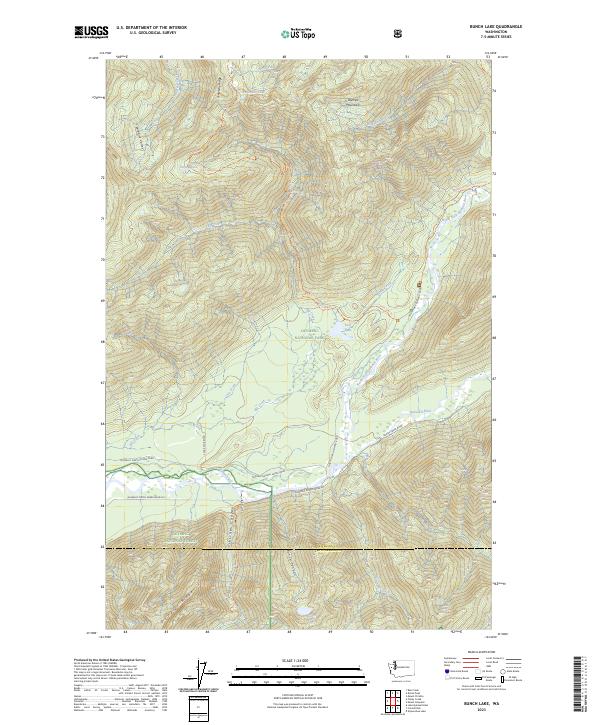
Layered geospatial PDF 7.5 Minute Quadrangle Map. Layers of geospatial data include orthoimagery, roads, grids, geographic names, elevation contours, hydrography, and other selected map features. This map is derived from GIS (geospatial information system) data. It represents a repackaging of GIS data in traditional map form, not creation of new information. The geospatial data in this map are from selected National Map data holdings and other government sources.
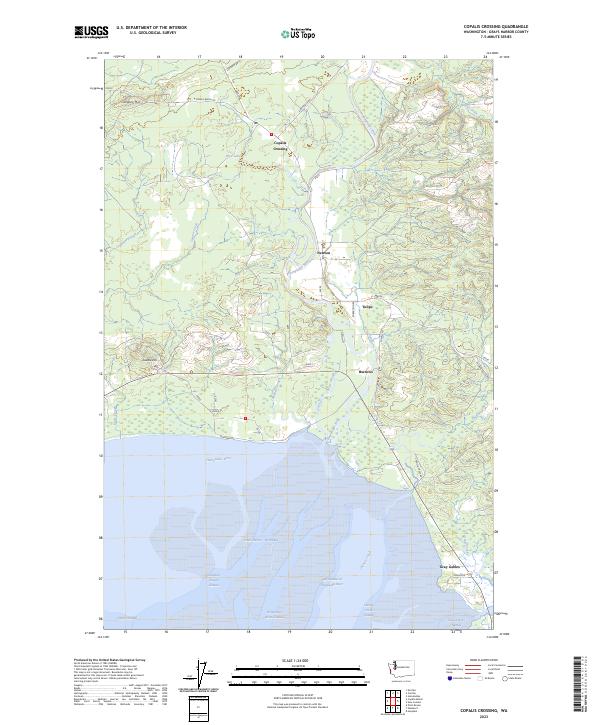
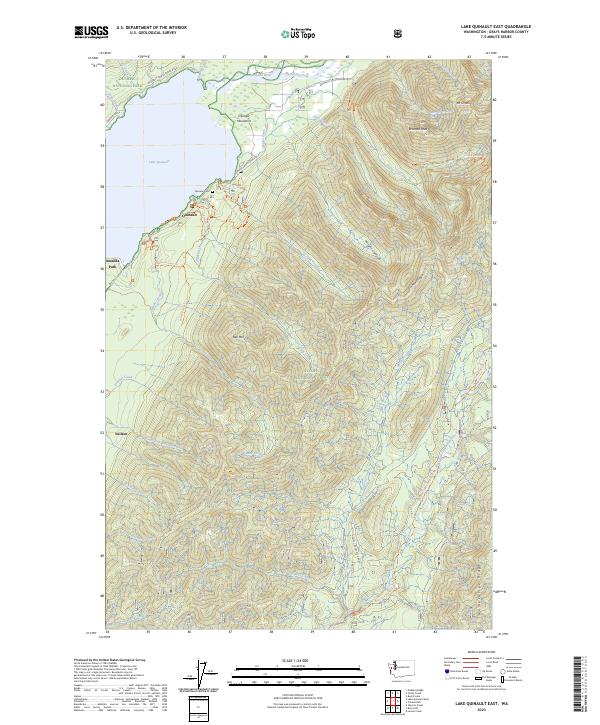
Layered geospatial PDF 7.5 Minute Quadrangle Map. Layers of geospatial data include orthoimagery, roads, grids, geographic names, elevation contours, hydrography, and other selected map features. This map is derived from GIS (geospatial information system) data. It represents a repackaging of GIS data in traditional map form, not creation of new information. The geospatial data in this map are from selected National Map data holdings and other government sources.
Layered geospatial PDF 7.5 Minute Quadrangle Map. Layers of geospatial data include orthoimagery, roads, grids, geographic names, elevation contours, hydrography, and other selected map features. This map is derived from GIS (geospatial information system) data. It represents a repackaging of GIS data in traditional map form, not creation of new information. The geospatial data in this map are from selected National Map data holdings and other government sources.
This portion of the USGS data release presents bathymetry data collected during surveys performed in the Columbia River littoral cell, Washington and Oregon in 2014 (USGS Field Activity Number 2014-631-FA). Bathymetry data were collected using four personal watercraft (PWCs) equipped with single-beam sonar systems and global navigation satellite system (GNSS) receivers. The sonar systems consisted of an Odom Echotrac CV-100 single-beam echosounder and 200 kHz transducer with a 9 degree beam angle. Raw acoustic backscatter returns were digitized by the echosounder with a vertical resolution of 1.25 cm. Depths from the echosounders were computed using sound velocity profiles measured using a YSI CastAway CTD during...
Categories: Data;
Types: Map Service,
OGC WFS Layer,
OGC WMS Layer,
OGC WMS Service;
Tags: Bathymetry and Elevation,
CMHRP,
Clatsop County,
Coastal and Marine Hazards and Resources Program,
Columbia River,
Layered geospatial PDF 7.5 Minute Quadrangle Map. Layers of geospatial data include orthoimagery, roads, grids, geographic names, elevation contours, hydrography, and other selected map features. This map is derived from GIS (geospatial information system) data. It represents a repackaging of GIS data in traditional map form, not creation of new information. The geospatial data in this map are from selected National Map data holdings and other government sources.
Layered geospatial PDF 7.5 Minute Quadrangle Map. Layers of geospatial data include orthoimagery, roads, grids, geographic names, elevation contours, hydrography, and other selected map features. This map is derived from GIS (geospatial information system) data. It represents a repackaging of GIS data in traditional map form, not creation of new information. The geospatial data in this map are from selected National Map data holdings and other government sources.
This data release is comprised of tidal marsh biomass data and spatial predictions of peak biomass and Julian day of peak biomass using data from the Landsat archive. Aboveground biomass dry weight of mixed-species plots (25x50 cm) at a tidal marsh in Willapa Bay, Washington were used to establish a relationship between biomass and tasseled cap greeness (TCG). The julian day of annual peak greenness and the value of annual peak greenness for 32 years at Bandon National Wildlife Refuge (NWR), Grays Harbor NWR, and Nisqually NWR was calculated by fitting a Gaussian function to the TCG values for a given year. The value of each 30 meter pixel is the Julian day of maximum predicted TCG or the maximum predicted TCG....
Layered geospatial PDF 7.5 Minute Quadrangle Map. Layers of geospatial data include orthoimagery, roads, grids, geographic names, elevation contours, hydrography, and other selected map features. This map is derived from GIS (geospatial information system) data. It represents a repackaging of GIS data in traditional map form, not creation of new information. The geospatial data in this map are from selected National Map data holdings and other government sources.
This portion of the USGS data release presents topography data collected during surveys performed in the Columbia River littoral cell, Washington and Oregon, in 2020 (USGS Field Activity Number 2020-622-FA). Topographic profiles were collected by walking along survey lines with global navigation satellite system (GNSS) receivers mounted on backpacks. Prior to data collection, vertical distances between the GNSS antennas and the ground were measured using a tape measure. Hand-held data collectors were used to log raw data and display navigational information allowing surveyors to navigate survey lines spaced at 100- to 1000-m intervals along the beach. Profiles were surveyed from the landward edge of the study area...
Categories: Data;
Types: Map Service,
OGC WFS Layer,
OGC WMS Layer,
OGC WMS Service;
Tags: Bathymetry and Elevation,
CMHRP,
Clatsop County,
Coastal and Marine Hazards and Resources Program,
Columbia River,
This portion of the USGS data release presents topography data collected during surveys performed in the Columbia River littoral cell, Washington and Oregon, in 2017 (USGS Field Activity Number 2017-666-FA). Topographic profiles were collected by walking along survey lines with global navigation satellite system (GNSS) receivers mounted on backpacks. Prior to data collection, vertical distances between the GNSS antennas and the ground were measured using a tape measure. Hand-held data collectors were used to log raw data and display navigational information allowing surveyors to navigate survey lines spaced at 100- to 1000-m intervals along the beach. Profiles were surveyed from the landward edge of the study area...
Categories: Data;
Types: Map Service,
OGC WFS Layer,
OGC WMS Layer,
OGC WMS Service;
Tags: Bathymetry and Elevation,
CMHRP,
Clatsop County,
Coastal and Marine Hazards and Resources Program,
Columbia River,
Layered geospatial PDF 7.5 Minute Quadrangle Map. Layers of geospatial data include orthoimagery, roads, grids, geographic names, elevation contours, hydrography, and other selected map features. This map is derived from GIS (geospatial information system) data. It represents a repackaging of GIS data in traditional map form, not creation of new information. The geospatial data in this map are from selected National Map data holdings and other government sources.
Layered geospatial PDF 7.5 Minute Quadrangle Map. Layers of geospatial data include orthoimagery, roads, grids, geographic names, elevation contours, hydrography, and other selected map features. This map is derived from GIS (geospatial information system) data. It represents a repackaging of GIS data in traditional map form, not creation of new information. The geospatial data in this map are from selected National Map data holdings and other government sources.
Layered geospatial PDF 7.5 Minute Quadrangle Map. Layers of geospatial data include orthoimagery, roads, grids, geographic names, elevation contours, hydrography, and other selected map features. This map is derived from GIS (geospatial information system) data. It represents a repackaging of GIS data in traditional map form, not creation of new information. The geospatial data in this map are from selected National Map data holdings and other government sources.
Layered geospatial PDF 7.5 Minute Quadrangle Map. Layers of geospatial data include orthoimagery, roads, grids, geographic names, elevation contours, hydrography, and other selected map features. This map is derived from GIS (geospatial information system) data. It represents a repackaging of GIS data in traditional map form, not creation of new information. The geospatial data in this map are from selected National Map data holdings and other government sources.
Layered geospatial PDF 7.5 Minute Quadrangle Map. Layers of geospatial data include orthoimagery, roads, grids, geographic names, elevation contours, hydrography, and other selected map features. This map is derived from GIS (geospatial information system) data. It represents a repackaging of GIS data in traditional map form, not creation of new information. The geospatial data in this map are from selected National Map data holdings and other government sources.
Layered geospatial PDF 7.5 Minute Quadrangle Map. Layers of geospatial data include orthoimagery, roads, grids, geographic names, elevation contours, hydrography, and other selected map features. This map is derived from GIS (geospatial information system) data. It represents a repackaging of GIS data in traditional map form, not creation of new information. The geospatial data in this map are from selected National Map data holdings and other government sources.
Layered geospatial PDF 7.5 Minute Quadrangle Map. Layers of geospatial data include orthoimagery, roads, grids, geographic names, elevation contours, hydrography, and other selected map features. This map is derived from GIS (geospatial information system) data. It represents a repackaging of GIS data in traditional map form, not creation of new information. The geospatial data in this map are from selected National Map data holdings and other government sources.
Layered geospatial PDF 7.5 Minute Quadrangle Map. Layers of geospatial data include orthoimagery, roads, grids, geographic names, elevation contours, hydrography, and other selected map features. This map is derived from GIS (geospatial information system) data. It represents a repackaging of GIS data in traditional map form, not creation of new information. The geospatial data in this map are from selected National Map data holdings and other government sources.
|

|
