Filters: Tags: Habitat (X) > partyWithName: U.S. Geological Survey (X)
168 results (103ms)|
Filters
Date Range
Extensions Types Contacts
Categories Tag Types
|

Geospatial data that is a derivative land cover product depicting woodland on topographic maps.
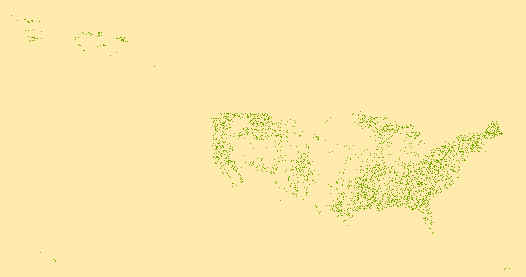
The Land Cover Data - Version 1.0 represents a highly thematically detailed land cover map of the U.S. The map legend includes types described by NatureServe's Ecological Systems Classification (Comer et al. 2002) as well as land use classes described in the National Land Cover Dataset 2001 (Homer et al. 2007). This version of the land cover data was used to support the Gap Analysis Project's vertebrate species modeling efforts. These data cover the entire continental U.S. and are a continuous data layer. These raster data have a 30 m x 30 m cell resolution. This land cover data set is considered official foundational data for the GAP species modeling process. The data have been made available provisionally to enhance...
Types: Citation,
Map Service,
OGC WFS Layer,
OGC WMS Layer,
OGC WMS Service;
Tags: Biodiversity,
Conservation,
Cover,
Habitat,
Habitats,
The dataset provides a spatially explicit estimate of 2019 herbaceous annual percent cover predicted on May 1st with an emphasis on annual grasses. The estimate is based on the mean output of two regression-tree models. For one model, we include, as an independent variable amongst other independent variables, a dataset that is the mean of 17-years of annual herbaceous percent cover (https://doi.org/10.5066/F71J98QK). This model's test mean error rate (n = 1670), based on nine different randomizations, equals 4.9% with a standard deviation of +/- 0.15. A second model was developed that did not include the mean of 17-years of annual herbaceous percent cover, and this model's test mean error rate (n = 1670), based...
Categories: Data;
Types: Downloadable,
GeoTIFF,
Map Service,
Raster;
Tags: Bromus tectorum,
California,
Colorado,
Desert,
Ecology,

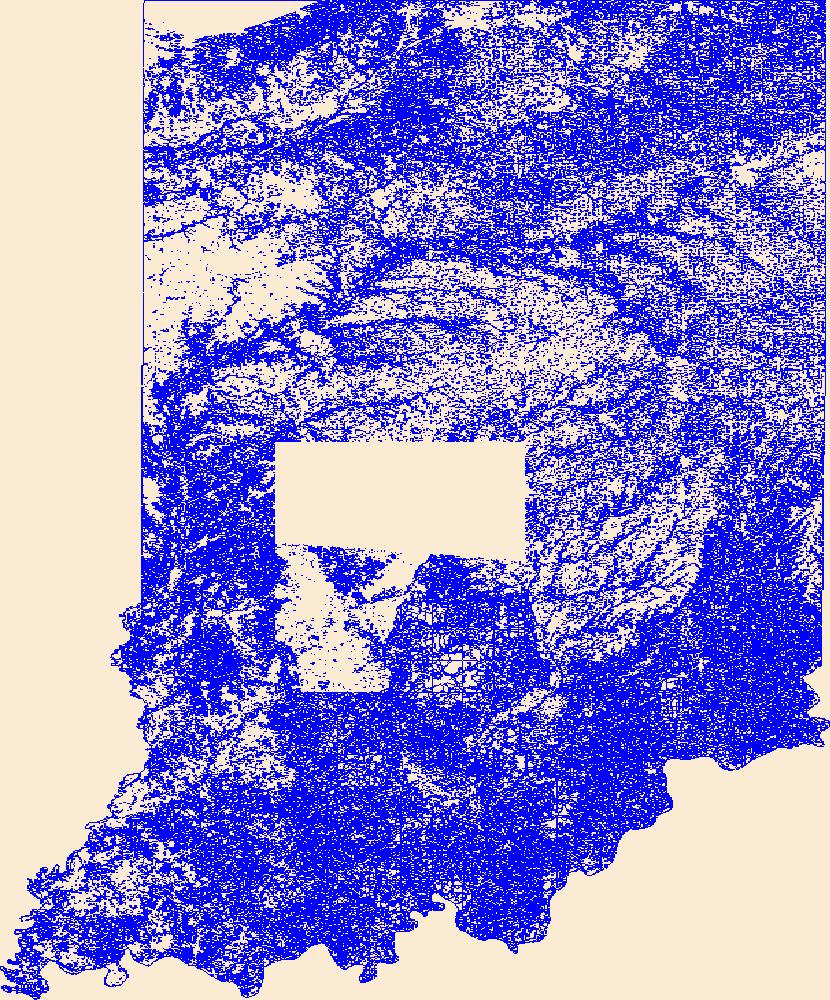
Geospatial data that is a derivative land cover product depicting woodland on topographic maps.

These data were released prior to the October 1, 2016 effective date for the USGS’s policy dictating the review, approval, and release of scientific data as referenced in USGS Survey Manual Chapter 502.8 Fundamental Science Practices: Review and Approval of Scientific Data for Release. The layers within this geodataset describe physical habitat characteristics in the North and South Fork Shenandoah rivers. They represent conditions during summer low-flow periods when canoeing was possible.The data are derived from GPS field surveys and GIS editing to commplete habitat units around islands or river bends.
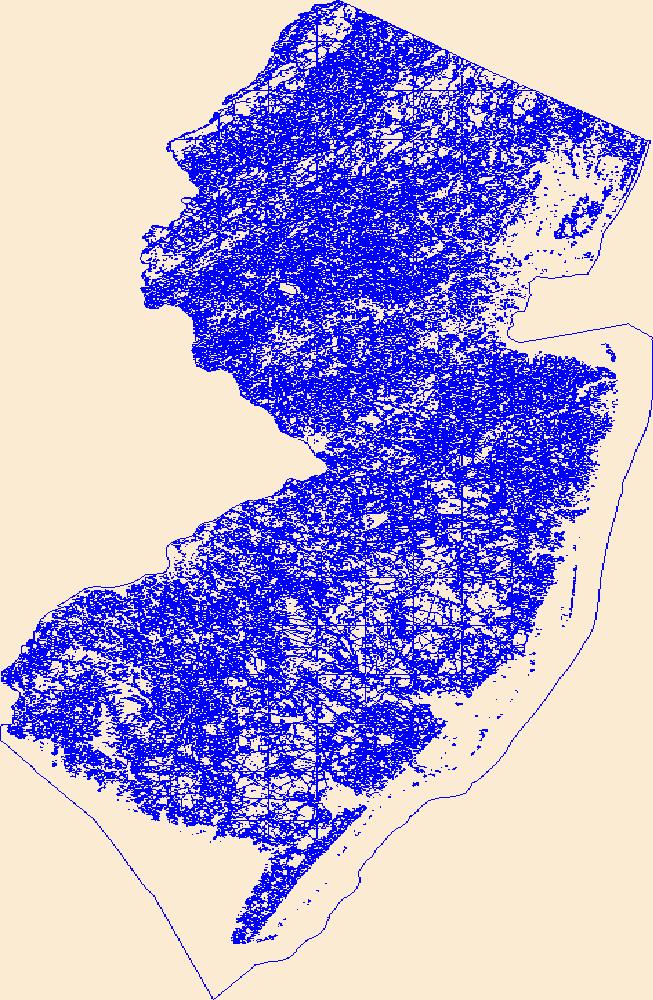
Geospatial data that is a derivative land cover product depicting woodland on topographic maps.

This part of the data release presents projected flooding extent polygon (flood masks) and flooding depth points (flood points) shapefiles based on wave-driven total water levels for Commonwealth of the Northern Mariana Islands (the islands of Saipan and Tinian). For each island there are 8 associated flood mask and flood depth shapefiles: one for each of four nearshore wave energy return periods (rp; 10-, 50-, 100-, and 500-years) and both with (wrf) and without (worf) the presence of coral reefs.
Categories: Data;
Types: Downloadable,
Map Service,
OGC WFS Layer,
OGC WMS Layer,
Shapefile;
Tags: CMHRP,
CNMI,
Coastal and Marine Hazards and Resources Program,
Commonwealth of the Northern Mariana Islands,
Coral Reef,
This part of the data release presents projected flooding extent polygon (flood masks) and flooding depth points (flood points) shapefiles based on wave-driven total water levels for the Territory of the U.S. Virgin Islands (the islands of Saint Croix, Saint John, and Saint Thomas). For each island there are 8 associated flood mask and flood depth shapefiles: one for each four nearshore wave energy return periods (rp; 10-, 50-, 100-, and 500-years) and both with (wrf) and without (worf) the presence of coral reefs. Flooding depth point data are also presented as a comma-separated value (.csv) text file.
Categories: Data;
Types: Downloadable,
Map Service,
OGC WFS Layer,
OGC WMS Layer,
Shapefile;
Tags: CMHRP,
Coastal and Marine Hazards and Resources Program,
Coral Reef,
Habitat,
PCMSC,
The data describe the number, density, date of collection, and exact collection location of fish eggs (from multiple species) collected in the St. Clair and Detroit Rivers from 2005-2016.
Categories: Data;
Types: Citation;
Tags: Detroit River,
St. Clair River,
fish,
habitat,
reproduction,
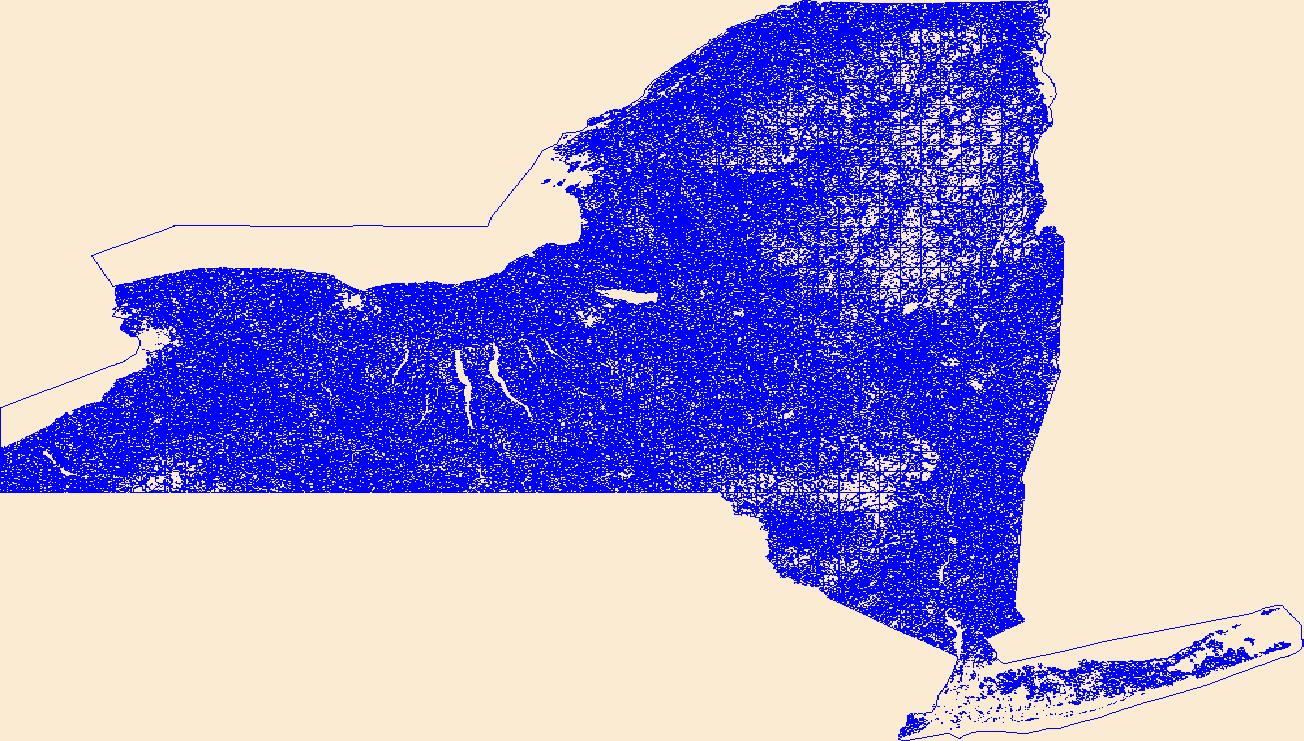
Geospatial data that is a derivative land cover product depicting woodland on topographic maps.
Geospatial data that is a derivative land cover product depicting woodland on topographic maps.
Geospatial data that is a derivative land cover product depicting woodland on topographic maps.
Geospatial data that is a derivative land cover product depicting woodland on topographic maps.
Geospatial data that is a derivative land cover product depicting woodland on topographic maps.
Geospatial data that is a derivative land cover product depicting woodland on topographic maps.
Geospatial data that is a derivative land cover product depicting woodland on topographic maps.
This data release includes metrics from the Regional Stream Quality Assessment (RSQA) from the Southeast Region for habitat stressors related to water-quality and habitat substrate. The goals of RSQA are to characterize multiple water-quality factors that are stressors to aquatic life ‐ contaminants, nutrients, sediment, and streamflow alteration – and to develop a better understanding of the relation of these stressors to ecological conditions in streams throughout the region. In order to characterize water-quality variables and stream-habitat measurements as an aggregation of multiple measurements over a sampling period, and in support of ecological stressor modelling, metrics (summary statistics or indices) were...
Potential habitat for the Ozark big-eared bat (Corynorhinus townsendii ingens) in Oklahoma was derived from the published Gap Analysis Project (GAP) Species Habitat Map.
The geospatial data presented here as ArcGIS layers denote landcover/landuse classifications to support field sampling efforts that occurred within the Cache Creek Settling Basin (CCSB) from 2010-2019. Manual photointerpretation of a National Agriculture Imagery Program (NAIP) dataset collected in 2012 was used to characterize landcover/landuse categories (hereafter habitat classes). Initially 9 categories were assigned based on vegetation structure (Vegtype1). These were then parsed into two levels of habitat classes that were chosen for their representativeness and use for statistical analyses of field sampling. At the coarsest level (Landcover 1), five habitat classes were assigned: Agriculture, Riparian,...
Geospatial data that is a derivative land cover product depicting woodland on topographic maps.
|

|
