Filters: Tags: Hydrology (X) > partyWithName: U.S. Geological Survey (X)
767 results (31ms)|
Filters
Date Range
Extensions
Types Contacts
Categories
Tag Types
|

These data were released prior to the October 1, 2016 effective date for the USGS’s policy dictating the review, approval, and release of scientific data as referenced in USGS Survey Manual Chapter 502.8 Fundamental Science Practices: Review and Approval of Scientific Data for Release. This digital dataset represents the surface hydrogeology of an approximately 45,000 square-kilometer area of the Death Valley regional ground-water flow system (DVRFS) in southern Nevada and California. Faunt and others (2004) constructed the map by merging mapped lithostratigraphic units into 27 hydrogeologic units (HGUs). The HGUs represent rocks and deposits of considerable lateral extent and distinct hydrologic properties. The...
Categories: pre-SM502.8;
Tags: Amargosa Desert,
Ash Meadows,
California,
California Valley,
Chicago Valley,

These data were released prior to the October 1, 2016 effective date for the USGS’s policy dictating the review, approval, and release of scientific data as referenced in USGS Survey Manual Chapter 502.8 Fundamental Science Practices: Review and Approval of Scientific Data for Release. This digital dataset defines the thickness of the Corcoran Clay Member of the Tulare Formation. The complex hydrologic system of the Central Valley is simulated using the USGS numerical modeling code MODFLOW-FMP (Schmid and others, 2006b). This simulation is referred to here as the Central Valley Hydrologic Model (CVHM) (Faunt, 2009). Utilizing MODFLOW-FMP, the CVHM simulates groundwater and surface-water flow, irrigated agriculture,...
Categories: pre-SM502.8;
Tags: CV-RASA,
California,
Central Valley,
Central Valley Aquifer,
Central Valley Hydrologic Model,

These data were released prior to the October 1, 2016 effective date for the USGS’s policy dictating the review, approval, and release of scientific data as referenced in USGS Survey Manual Chapter 502.8 Fundamental Science Practices: Review and Approval of Scientific Data for Release. This digital data set defines the subregions of the transient ground-water flow model of the Death Valley regional ground-water flow system (DVRFS). Subregions are used to more readily describe and evaluate the source, occurrence, and movement of ground water within and between the smaller areas of the DVRFS, which is an approximately 45,000 square- kilometer region of southern Nevada and California. The subregions, first described...
Categories: pre-SM502.8;
Tags: Amargosa Desert,
Ash Meadows,
California,
California Valley,
Chicago Valley,
These data were released prior to the October 1, 2016 effective date for the USGS’s policy dictating the review, approval, and release of scientific data as referenced in USGS Survey Manual Chapter 502.8 Fundamental Science Practices: Review and Approval of Scientific Data for Release. Point coverage of bathymetry data for Lake Darling in Washington Co., Iowa. The U.S. Geological Survey conducted a bathymetric survey of Lake Darling in 2004.

These data were released prior to the October 1, 2016 effective date for the USGS’s policy dictating the review, approval, and release of scientific data as referenced in USGS Survey Manual Chapter 502.8 Fundamental Science Practices: Review and Approval of Scientific Data for Release. Point coverage of bathymetry data for Upper Gar Lake in Dickinson Co., Iowa. The U.S. Geological Survey conducted a bathymetric survey of Upper Gar Lake in 2004.
These data were released prior to the October 1, 2016 effective date for the USGS’s policy dictating the review, approval, and release of scientific data as referenced in USGS Survey Manual Chapter 502.8 Fundamental Science Practices: Review and Approval of Scientific Data for Release. This data set consists of digital bathymetry contours for Lake Minnewashta in Dickinson Co., Iowa. The U.S. Geological Survey conducted a bathymetric survey of Lake Minnewashta in 2004.

These data were released prior to the October 1, 2016 effective date for the USGS’s policy dictating the review, approval, and release of scientific data as referenced in USGS Survey Manual Chapter 502.8 Fundamental Science Practices: Review and Approval of Scientific Data for Release. This digital dataset defines the model grid, water-balance subregions (WBSs), soil types, and virtual crops for the five land-use time-frames in the transient hydrologic model of the Central Valley flow system. The Central Valley encompasses an approximate 50,000 square-kilometer region of California. The complex hydrologic system of the Central Valley is simulated using the USGS numerical modeling code MODFLOW-FMP (Schmid and others,...
Categories: pre-SM502.8;
Tags: Alameda County,
Amador County,
Butte County,
CV-RASA,
Calaveras County,

These data were released prior to the October 1, 2016 effective date for the USGS’s policy dictating the review, approval, and release of scientific data as referenced in USGS Survey Manual Chapter 502.8 Fundamental Science Practices: Review and Approval of Scientific Data for Release. A natural consequence of groundwater withdrawals is the removal of water from subsurface storage, but the overall rates and magnitude of groundwater depletion in the United States are not well characterized. This study evaluates long-term cumulative depletion volumes in 40 separate aquifers or areas and one land use category in the United States, bringing together information from the literature and from new analyses. Depletion is...

These data were released prior to the October 1, 2016 effective date for the USGS’s policy dictating the review, approval, and release of scientific data as referenced in USGS Survey Manual Chapter 502.8 Fundamental Science Practices: Review and Approval of Scientific Data for Release. The USGS compiles online access to water-resources data collected at approximately 1.5 million sites in all 50 States, the District of Columbia, Puerto Rico, the Virgin Islands, Guam, American Samoa and the Commonwealth of the Northern Mariana Islands.
The dataset contains a hybrid bathymetric-topographic digital elevation model (DEM) of the Missouri River at Searcys Bend, near Columbia, Missouri. The DEM was generated within ArcGIS by compositing bathymetric data from multiple single and multibeam sonar surveys collected between September 2019 and July 2021 with previously existing topographic data collected from airborne LiDAR into a triangulated irregular network (TIN). The resulting TIN was then manually edited and exported as a raster for use in developing a hydrodynamic model.
The Bushy Park Reservoir is a relatively shallow impoundment in a semi-tropical climate and is the principal water supply for the 400,000 people of the City of Charleston and the surrounding areas including the industries in the Bushy Park Industrial Complex. Although there is an adequate supply of freshwater in the reservoir, there are taste-and-odor water-quality concerns. The U.S. Geological Survey (USGS) worked in cooperation with the Charleston Water System to study the hydrology and water-quality of the Bushy Park Reservoir to identify factors affecting water-quality conditions. This data release is for water-quality profiles collected with a hand-held calibrated field meter from a manned boat concurrent with...
Categories: Data;
Types: Citation;
Tags: Back River, Berkeley County, SC,
hydrology,
limnology,
phycocyanin fluorescence,
specific conductance,
This file (wymt_ffa_2022Yellowstone_WATSTORE.txt) contains peak-flow input data for PeakFQ for peak-flow frequency analyses for selected streamgages based on data through water year 2022. The file format is called WATSTORE (National Water Data Storage and Retrieval System) available from NWISWeb (http://nwis.waterdata.usgs.gov/usa/nwis/peak).
Types: Map Service,
OGC WFS Layer,
OGC WMS Layer,
OGC WMS Service;
Tags: Carbon County, MT,
Clarks Fork Yellowstone,
Land,
Map Service,
Montana,
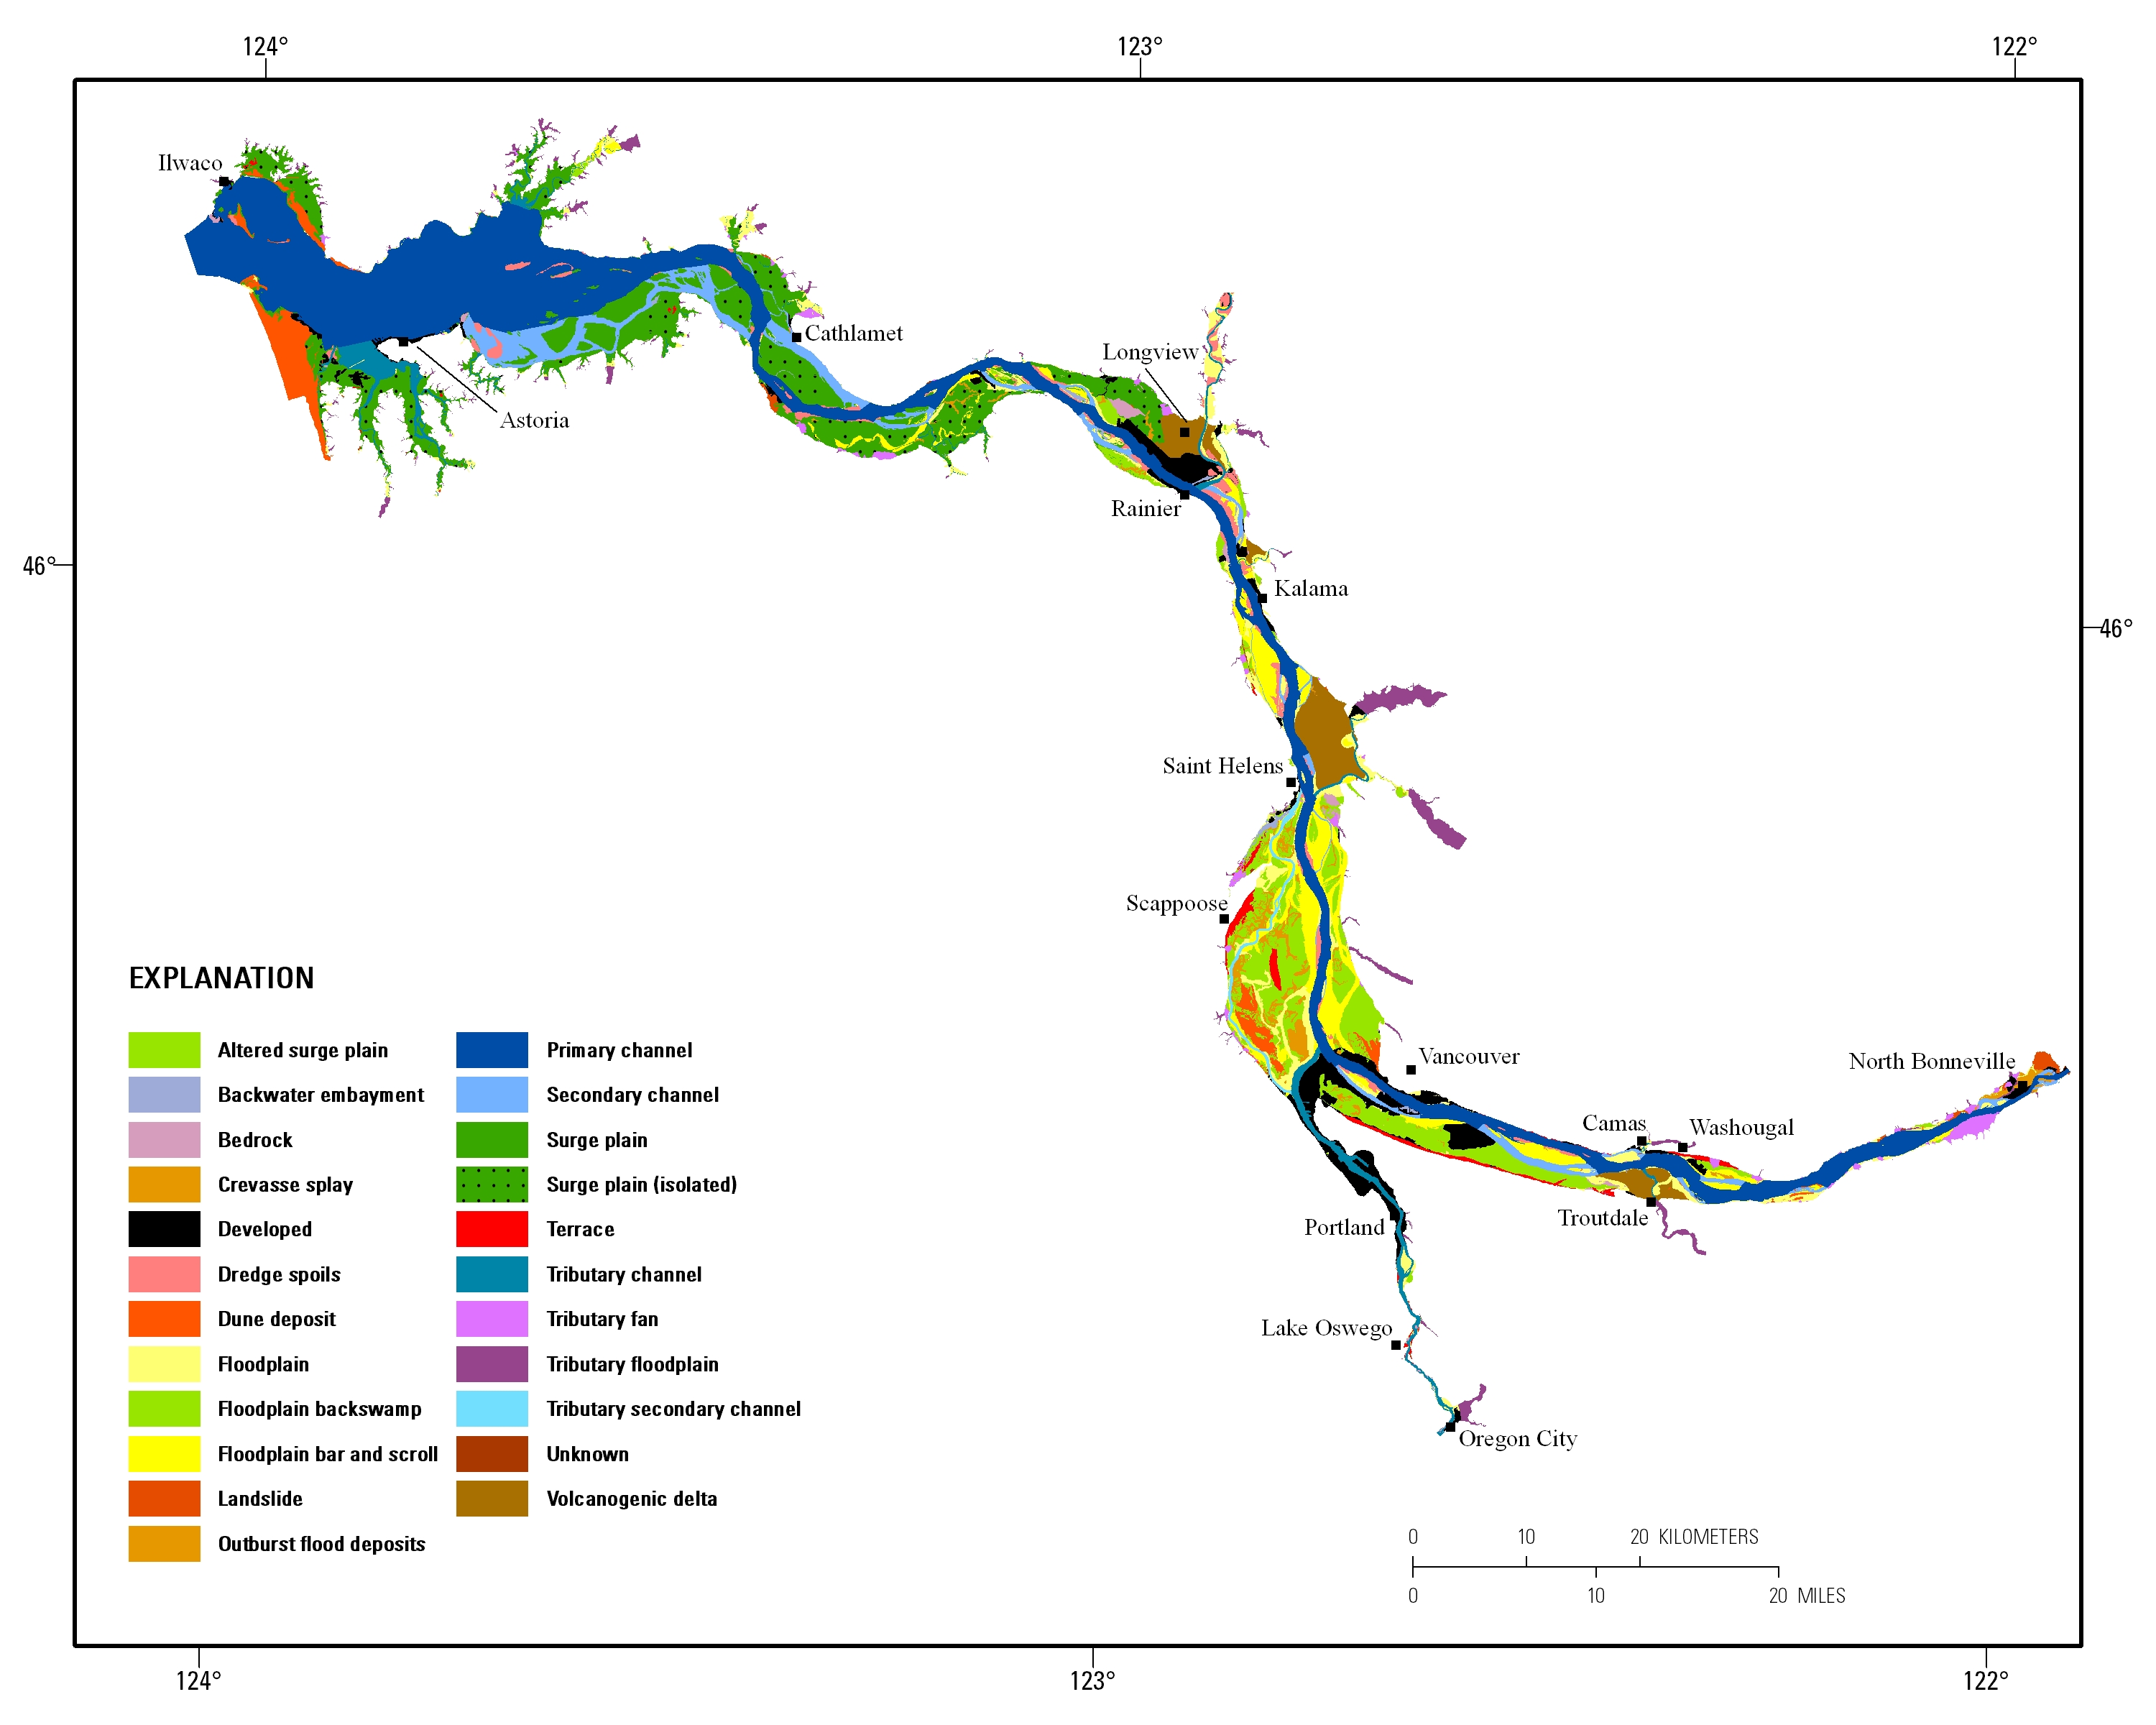
Estuarine ecosystems are controlled by a variety of processes that operate at multiple spatial and temporal scales. Understanding the hierarchical nature of these processes will aid in prioritization of restoration efforts. This hierarchical Columbia River Estuary Ecosystem Classification (henceforth "Classification") of the Columbia River estuary is a spatial database of the tidally-influenced reaches of the lower Columbia River, the tidally affected parts of its tributaries, and the landforms that make up their floodplains for the 230 kilometers between the Pacific Ocean and Bonneville Dam. This work is a collaborative effort between University of Washington School of Aquatic and Fishery Sciences (henceforth "UW"),...
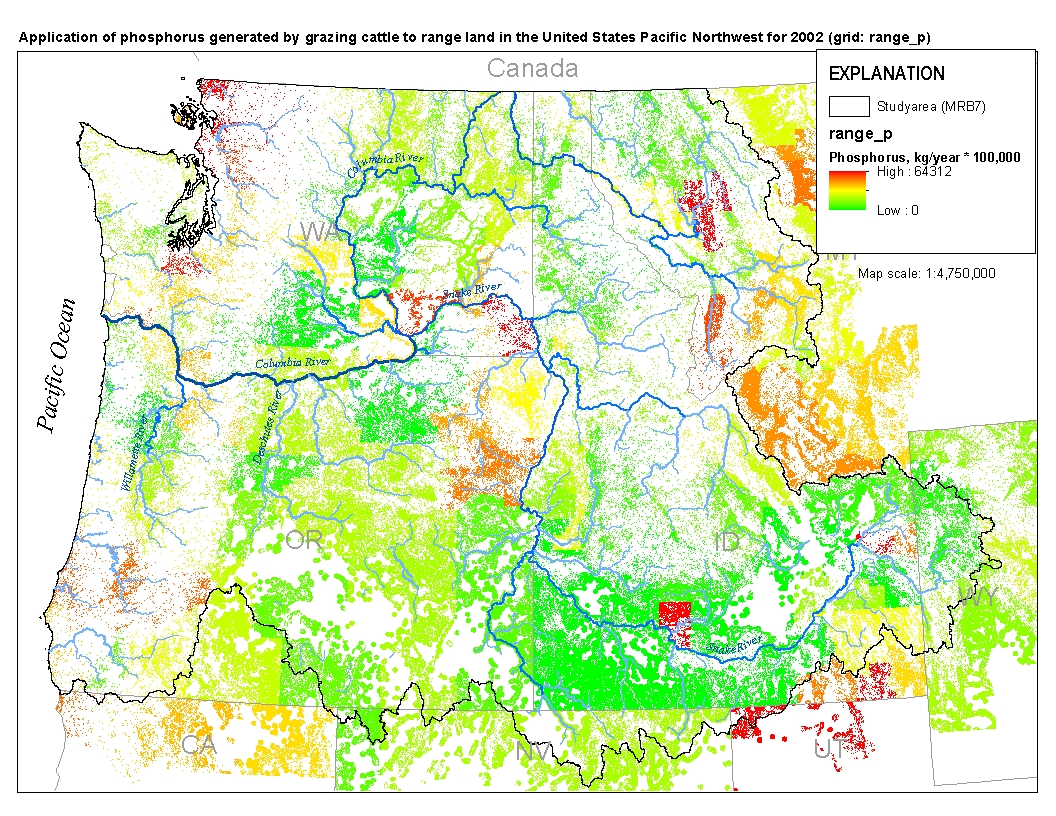
This spatial data set was created by the U.S. Geological Survey (USGS) to represent the amount of phosphorus generated by grazing cattle that was applied to range land in the Pacific Northwest region of the United States (Hydro Region 17; Major River Basin 7 (MRB7)) during 2002.
This dataset contains processed simulation results and field data of a larval drift experiment conducted on July 1, 2019, on the Upper Missouri River.
This dataset includes tables of 3He-isotopic data used to calculate surface exposure ages for samples of basalt, and U- and Th-isotopic data used to calculate uranium-series age estimates (230Th/U method) and initial 234U/238U activity ratios for samples of pedogenic carbonate formed in soils on alluvial fans in the San Luis Valley, Colorado, USA. These data are included in the publication: Ruleman, C.A., Hudson, A.M., Thompson, R.A., Miggins, D.P., Paces, J.B., Goehring, B.M., 2019, Middle Pleistocene formation of the Rio Grande Gorge, San Luis Valley, south-central Colorado and north-central New Mexico, USA: process, timing, and downstream implications. Quaternary Science Reviews 223, https://doi.org/10.1016/j.quascirev.2019.07.028.
This data release supports the U.S. Geological Survey Scientific Investigation Map (SIM) by Clark and others (2020) by documenting the data used to create the geologic maps and describes the geologic framework and hydrostratigraphy of the Edwards and Trinity aquifers for a 442 square-mile area in northern Medina County in south Texas. The karstic Edwards and Trinity aquifers that are the subject of the SIM by Clark and others (2020) are classified as major sources of water in south-central Texas by the Texas Water Development Board (George and others, 2011). The geologic framework and hydrostratigraphy of the Edwards and Trinity aquifers largely control groundwater flow paths and storage in northern Medina County...
The Chicot aquifer system underlies an area of approximately 9,500 mi2 in southwestern Louisiana and is located within the Gulf Coastal Plain physiographic province. The region includes all or parts of 15 parishes -- Vernon, Rapides, Evangeline, Allen, Beauregard, Calcasieu, Jefferson Davis, Acadia, St. Landry, Lafayette, St. Martin, Cameron, Iberia, Vermilion, and St. Mary. The Chicot aquifer system is a major source of groundwater for southwestern Louisiana, accounts for approximately 48 percent of all groundwater use in the State, and provides freshwater for public supply, industry, agriculture, and aquaculture (Collier and Sargent, 2018). Withdrawals of groundwater have created water-level gradients favorable...
Categories: Data;
Types: Downloadable,
Map Service,
OGC WFS Layer,
OGC WMS Layer,
Shapefile;
Tags: Acadia Parish,
Allen Parish,
Beauregard Parish,
CLAS,
Calcasieu Parish,
Digital flood-inundation maps for a 6.6-mile reach of the St. Joseph River at Elkhart, Indiana were created by the U.S. Geological Survey (USGS) in cooperation with the Indiana Office of Community and Rural Affairs. The flood-inundation maps, which can be accessed through the USGS Flood Inundation Mapping Science Web site at http://water.usgs.gov/osw/flood_inundation/, depict estimates of the areal extent and depth of flooding corresponding to selected water levels (stages) at the USGS streamgage 04101000, St. Joseph River at Elkhart, Ind. Near-real-time stages at this streamgage may be obtained on the Internet from the USGS National Water Information System at http://waterdata.usgs.gov/ or the National Weather...
This data set provides locations and values of water quality parameters from a survey conducted on August 25, 2016 using an Autonomous Underwater Vehicle (AUV) in Nicoll Bay, NY. During the August 25 survey, 12,275 observations of water quality parameters were made. Parameters collected include dissolved oxygen, pH, water temperature, specific conductance, and salinity. Data was collected in approximately east-west transects by the AUV, with the northern-most transects made first. Data was collected between the hours of 1 am and 5 am to obtain minimum DO values in the daily cycle. There are three files available for download in the 'Attached Files' section below. There is a zip file which contains the observation...
Categories: Data;
Types: Downloadable,
Map Service,
OGC WFS Layer,
OGC WMS Layer,
Shapefile;
Tags: Autonomous Underwater Vehicle,
Brown Creek,
Connetquot River,
Great South Bay,
Long Island,
|

|
