Filters: Tags: Kings County (X)
234 results (89ms)|
Filters
Date Range
Extensions Types
Contacts
Categories Tag Types
|

These data were released prior to the October 1, 2016 effective date for the USGS’s policy dictating the review, approval, and release of scientific data as referenced in USGS Survey Manual Chapter 502.8 Fundamental Science Practices: Review and Approval of Scientific Data for Release. Abstract: This digital dataset contains the virtual wells used for pumpage for the Central Valley Hydrologic Model (CVHM). The Central Valley encompasses an approximate 50,000 square-kilometer region of California. The complex hydrologic system of the Central Valley is simulated using the U.S. Geological Survey (USGS) numerical modeling code MODFLOW-FMP (Schmid and others, 2006). This simulation is referred to here as the CVHM (Faunt,...
Categories: pre-SM502.8;
Tags: Alameda County,
Amador County,
Butte County,
CV-RASA,
Calaveras County,
The data contained in this data release support USGS Scientific Investigations Report 2020-5023, "Distribution of selected hydrogeologic characteristics of the upper glacial and Magothy aquifers, Long Island, New York" (Walter and Finkelstein, 2020). This data release contains estimates of aquifer texture describing the Long Island aquifer system. These estimates in total can be considered a model of aquifer texture describing unconsolidated sediments in the following principal units: 1) Upper glacial aquifer, 2) Jameco aquifer, 3) Monmouth Greensand confining unit, and 4) Magothy aquifer. The Lloyd aquifer, a major aquifer on Long Island, is not included in the model due to a lack of available data. Aquifer texture...
This data release has been deprecated. Please see new data release here: https://doi.org/10.5066/P9ETQ00R The U.S. Geological Survey Groundwater Ambient Monitoring and Assessment-Priority Basin Project (USGS GAMA-PBP) collected samples to be analyzed for per-and polyfluoroalkyl substances (PFAS) from domestic and public supply wells from May 2019 to June 2021. The datasets presented here include identification of the 28 PFAS constituents monitored by the project, Identification and brief characterization of the 395 GAMA-PBP wells for which samples were analyzed for PFAS during the study period, and analytical results for those groundwater samples, along with results for quality control samples.
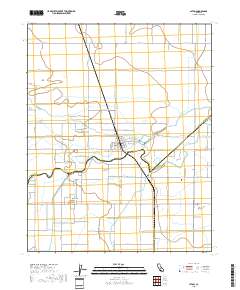
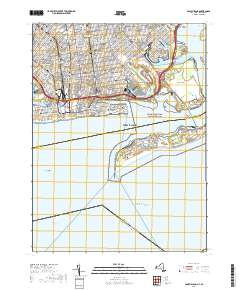
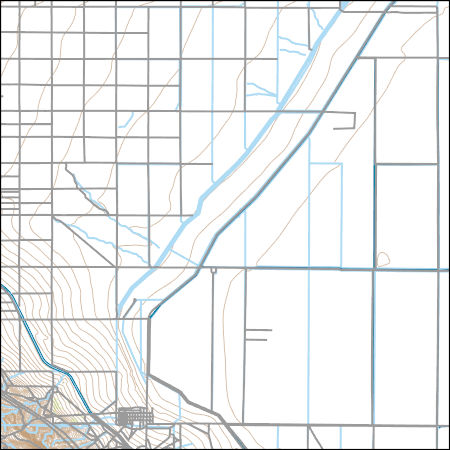
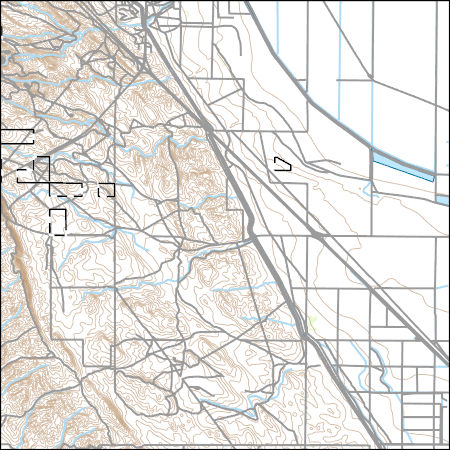
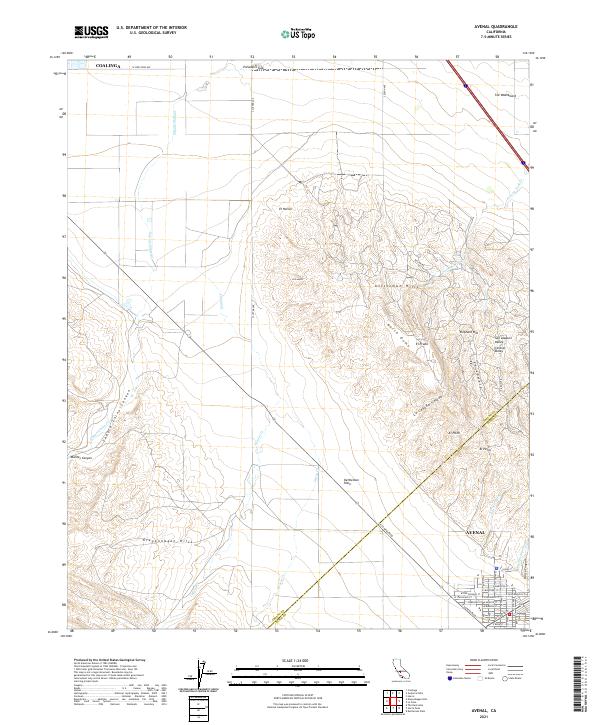
Layered geospatial PDF 7.5 Minute Quadrangle Map. Layers of geospatial data include orthoimagery, roads, grids, geographic names, elevation contours, hydrography, and other selected map features. This map is derived from GIS (geospatial information system) data. It represents a repackaging of GIS data in traditional map form, not creation of new information. The geospatial data in this map are from selected National Map data holdings and other government sources.
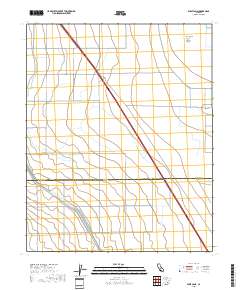
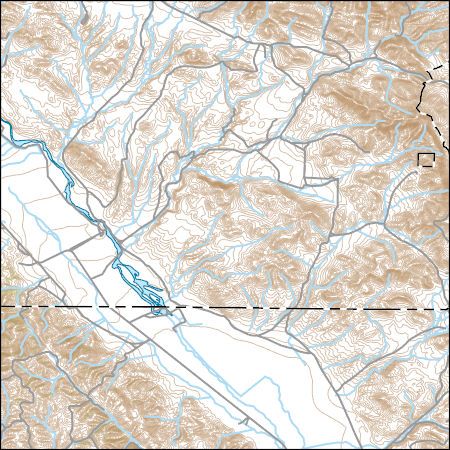
Layered geospatial PDF 7.5 Minute Quadrangle Map. Layers of geospatial data include orthoimagery, roads, grids, geographic names, elevation contours, hydrography, and other selected map features. This map is derived from GIS (geospatial information system) data. It represents a repackaging of GIS data in traditional map form, not creation of new information. The geospatial data in this map are from selected National Map data holdings and other government sources.
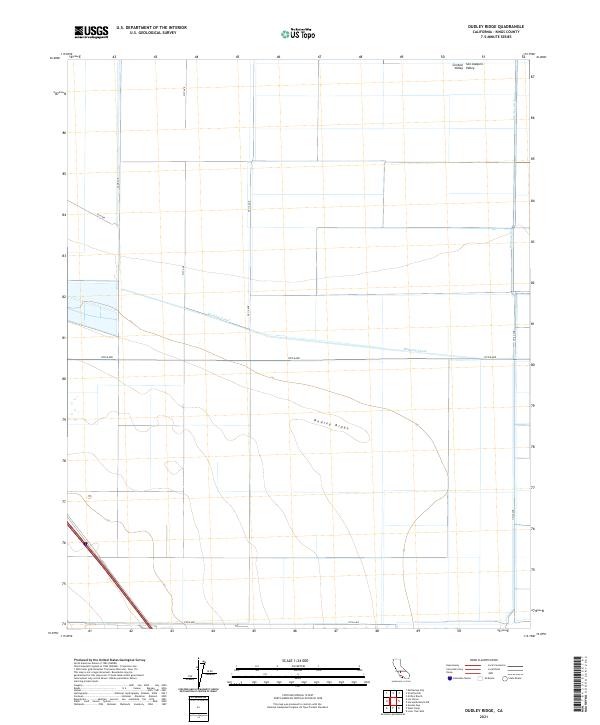
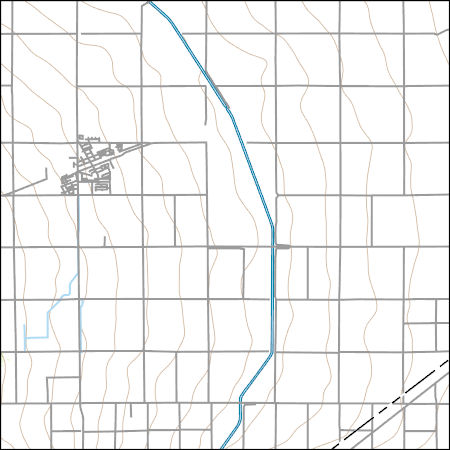
Layered geospatial PDF 7.5 Minute Quadrangle Map. Layers of geospatial data include orthoimagery, roads, grids, geographic names, elevation contours, hydrography, and other selected map features. This map is derived from GIS (geospatial information system) data. It represents a repackaging of GIS data in traditional map form, not creation of new information. The geospatial data in this map are from selected National Map data holdings and other government sources.
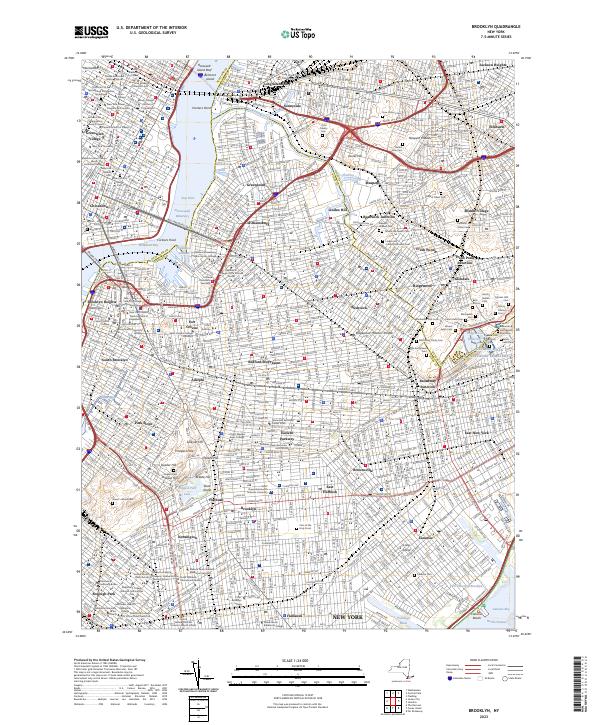
Layered geospatial PDF 7.5 Minute Quadrangle Map. Layers of geospatial data include orthoimagery, roads, grids, geographic names, elevation contours, hydrography, and other selected map features. This map is derived from GIS (geospatial information system) data. It represents a repackaging of GIS data in traditional map form, not creation of new information. The geospatial data in this map are from selected National Map data holdings and other government sources.
Layered geospatial PDF 7.5 Minute Quadrangle Map. Layers of geospatial data include orthoimagery, roads, grids, geographic names, elevation contours, hydrography, and other selected map features. This map is derived from GIS (geospatial information system) data. It represents a repackaging of GIS data in traditional map form, not creation of new information. The geospatial data in this map are from selected National Map data holdings and other government sources.
This dataset has been archived; it has been superseded by version 3.0 (November 2021) which can be found at https://doi.org/10.5066/P954DLLC . The data contained in this data release support USGS Scientific Investigations Report 2020-5023, "Distribution of selected hydrogeologic characteristics of the upper glacial and Magothy aquifers, Long Island, New York" (Walter and Finkelstein, 2020). This data release contains estimates of aquifer texture describing the Long Island aquifer system. These estimates in total can be considered a model of aquifer texture describing unconsolidated sediments in the following principal units: 1) Upper glacial aquifer, 2) Jameco aquifer, 3) Monmouth Greensand confining unit, and...
USGS Topo Map Vector Data (Vector) 25412 Lemoore, California 20220511 for 7.5 x 7.5 minute Shapefile
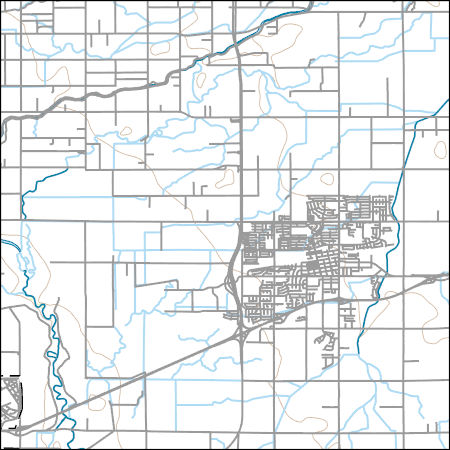
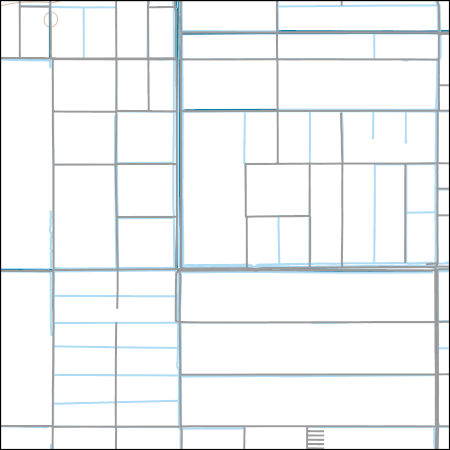
Layers of geospatial data include contours, boundaries, land cover, hydrography, roads, transportation, geographic names, structures, and other selected map features.
Layers of geospatial data include contours, boundaries, land cover, hydrography, roads, transportation, geographic names, structures, and other selected map features.
Layers of geospatial data include contours, boundaries, land cover, hydrography, roads, transportation, geographic names, structures, and other selected map features.
Layers of geospatial data include contours, boundaries, land cover, hydrography, roads, transportation, geographic names, structures, and other selected map features.
Layers of geospatial data include contours, boundaries, land cover, hydrography, roads, transportation, geographic names, structures, and other selected map features.
Layers of geospatial data include contours, boundaries, land cover, hydrography, roads, transportation, geographic names, structures, and other selected map features.

Layers of geospatial data include contours, boundaries, land cover, hydrography, roads, transportation, geographic names, structures, and other selected map features.
Layered geospatial PDF 7.5 Minute Quadrangle Map. Layers of geospatial data include orthoimagery, roads, grids, geographic names, elevation contours, hydrography, and other selected map features. This map is derived from GIS (geospatial information system) data. It represents a repackaging of GIS data in traditional map form, not creation of new information. The geospatial data in this map are from selected National Map data holdings and other government sources.
This data release contains the output from a Soil-Water-Balance (SWB) model (Westenbroek and others, 2010), used to estimate potential recharge to the Long Island regional aquifer system from 1900-2019. Output data for two SWB simulations are included. The first simulation uses available land-use/land-cover datasets to estimate recharge with changing land use from 1900-2019 (referred to as the post-development simulation). The second simulation assumed a forested, undeveloped (predevelopment simulation) condition across Long Island for the same period. The same soil coverages and time-series climate data were used throughout both simulations. Potential recharge was spatially distributed as gridded output across...
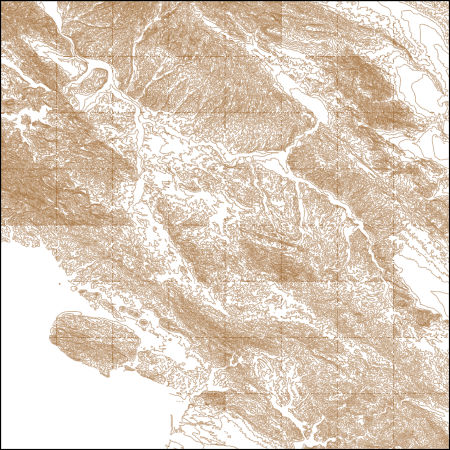
These vector contour lines are derived from the 3D Elevation Program using automated and semi-automated processes. They were created to support 1:24,000-scale CONUS and Hawaii, 1:25,000-scale Alaska, and 1:20,000-scale Puerto Rico / US Virgin Island topographic map products, but are also published in this GIS vector format. Contour intervals are assigned by 7.5-minute quadrangle, so this vector dataset is not visually seamless across quadrangle boundaries. The vector lines have elevation attributes (in feet above mean sea level on NAVD88), but this dataset does not carry line symbols or annotation.
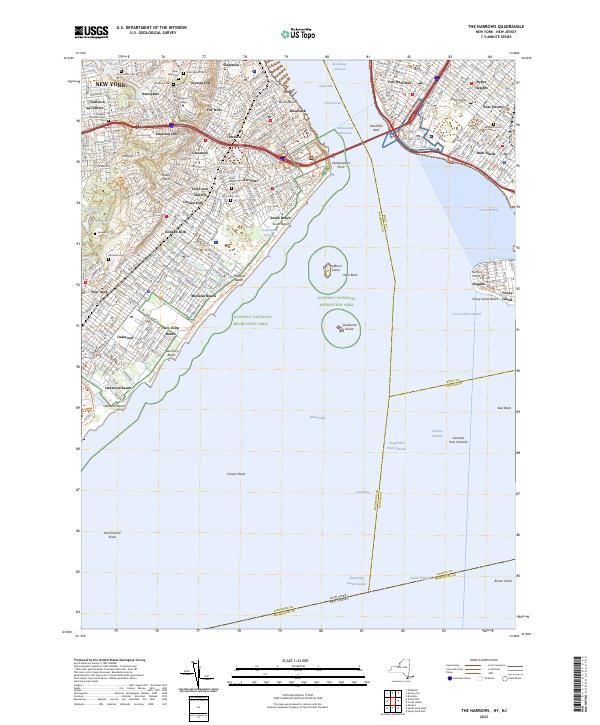
Layered geospatial PDF 7.5 Minute Quadrangle Map. Layers of geospatial data include orthoimagery, roads, grids, geographic names, elevation contours, hydrography, and other selected map features. This map is derived from GIS (geospatial information system) data. It represents a repackaging of GIS data in traditional map form, not creation of new information. The geospatial data in this map are from selected National Map data holdings and other government sources.
|

|
