Filters: Tags: Kings County (X)
234 results (96ms)|
Filters
Date Range
Extensions Types
Contacts
Categories Tag Types
|
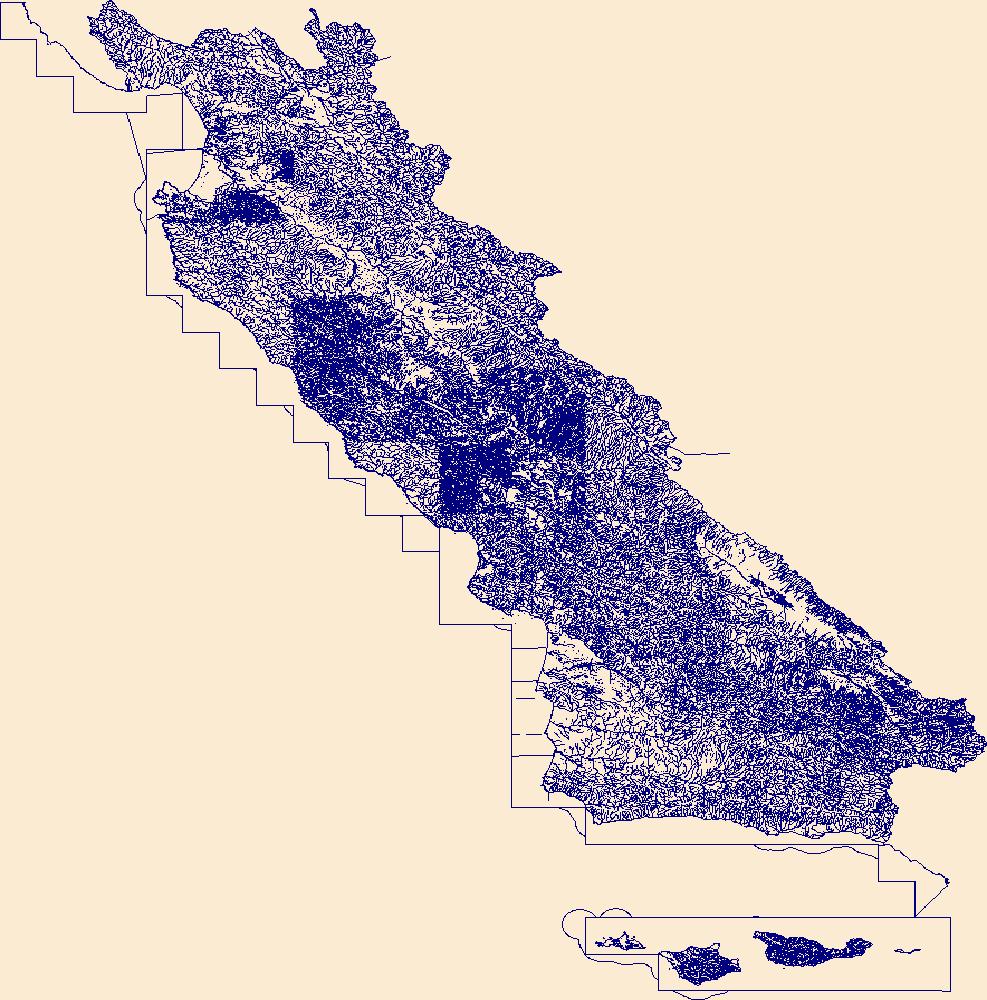
These vector contour lines are derived from the 3D Elevation Program using automated and semi-automated processes. They were created to support 1:24,000-scale CONUS and Hawaii, 1:25,000-scale Alaska, and 1:20,000-scale Puerto Rico / US Virgin Island topographic map products, but are also published in this GIS vector format. Contour intervals are assigned by 7.5-minute quadrangle, so this vector dataset is not visually seamless across quadrangle boundaries. The vector lines have elevation attributes (in feet above mean sea level on NAVD88), but this dataset does not carry line symbols or annotation.
Layers of geospatial data include contours, boundaries, land cover, hydrography, roads, transportation, geographic names, structures, and other selected map features.
The U.S. Geological Survey collected groundwater samples from 95 domestic wells in Tulare and Kings Counties, California in 2014-2015. The wells were sampled for the Tulare Shallow Aquifer Study Unit of the California State Water Resources Control Board Groundwater Ambient Monitoring and Assessment (GAMA) Program Priority Basin Project’s assessment of the quality of groundwater resources used for domestic drinking water supply. Domestic wells commonly are screened at shallower depths than are public-supply wells. The Tulare Shallow Aquifer Study Unit includes the Kaweah, Tule, and Tulare Lake subbasins of the San Joaquin Valley groundwater basin and adjacent areas of the Sierra Nevada. The study unit was divided...
Categories: Data;
Tags: California,
Environment,
GAMA,
Groundwater,
Groundwater Ambient Monitoring and Assessment Program,
High concentrations of uranium were detected in samples from wells used for domestic drinking water supplies in the San Joaquin Valley. Of 163 domestic wells sampled by the California Groundwater Ambient Monitoring and Assessment Program Priority Basin Project (GAMA-PBP) and the National Water Quality Program (NWQP) in 2008-2015, 26 percent had uranium concentrations greater than the U.S. Environmental Protection Agency maximum contaminant level (EPA MCL) of 30 µg/L, with 13 percent of the wells having uranium concentration between 100 µg/L and 450 µg/L. To evaluate the potential anthropogenic and geologic causes of these anomalously high uranium concentrations, Rosen and others (2019) compiled water quality and...
Layers of geospatial data include contours, boundaries, land cover, hydrography, roads, transportation, geographic names, structures, and other selected map features.
Layers of geospatial data include contours, boundaries, land cover, hydrography, roads, transportation, geographic names, structures, and other selected map features.
Layers of geospatial data include contours, boundaries, land cover, hydrography, roads, transportation, geographic names, structures, and other selected map features.
Layers of geospatial data include contours, boundaries, land cover, hydrography, roads, transportation, geographic names, structures, and other selected map features.
Layers of geospatial data include contours, boundaries, land cover, hydrography, roads, transportation, geographic names, structures, and other selected map features.
Layers of geospatial data include contours, boundaries, land cover, hydrography, roads, transportation, geographic names, structures, and other selected map features.
This model archive makes available the Soil-Water-Balance (SWB) model (Westenbroek and others, 2010) and input data used to estimate the potential amount of annual groundwater recharge to the Long Island aquifer system from 1900 to 2019 as described in U.S. Geological Survey Scientific Investigations Report 2021-5143. Input data for two SWB simulations are included in the archive. The first simulation uses existing land-use/land-cover datasets to estimate changes in recharge with changing land use from 1900-2019 (referred to as the post-development simulation). The second simulation assumed a forested, undeveloped (pre-development simulation) condition across Long Island for the same period. The same soil coverages...
The High Resolution National Hydrography Dataset Plus (NHDPlus HR) is an integrated set of geospatial data layers, including the best available National Hydrography Dataset (NHD), the 10-meter 3D Elevation Program Digital Elevation Model (3DEP DEM), and the National Watershed Boundary Dataset (WBD). The NHDPlus HR combines the NHD, 3DEP DEMs, and WBD to create a stream network with linear referencing, feature naming, "value added attributes" (VAAs), elevation-derived catchments, and other features for hydrologic data analysis. The stream network with linear referencing is a system of data relationships applied to hydrographic systems so that one stream reach "flows" into another and "events" can be tied to and traced...
This data release contains model simulation results of a particle tracking analysis to delineate areas that provide recharge to surface waters and public-supply wells on Long Island, NY. The analysis partitions the recharge areas based on particle travel times of greater than or less than 10 years to reach the receiving surface water or well. The simulation was performed using a regional-scale numerical model of the Long Island aquifer system (Walter and others, 2020a and 2020b) for average 2005-2015 conditions. The model implements MODFLOW-NWT (Niswonger and others, 2011) to represent steady-state groundwater pumping and aquifer recharge conditions; recharge areas were identified and partitioned using the particle-tracking...

These data were released prior to the October 1, 2016 effective date for the USGS’s policy dictating the review, approval, and release of scientific data as referenced in USGS Survey Manual Chapter 502.8 Fundamental Science Practices: Review and Approval of Scientific Data for Release. This digital dataset contains the virtual wells used for urban (municipal and industrial use) pumpage for the Central Valley Hydrologic Model (CVHM). The Central Valley encompasses an approximate 50,000 square-kilometer region of California. The complex hydrologic system of the Central Valley is simulated using the U.S. Geological Survey (USGS) numerical modeling code MODFLOW-FMP (Schmid and others, 2006). This application is referred...

A previously developed three-dimensional steady-state groundwater flow model (https://doi.org/10.3133/sir20205091) is used to assist resource managers and planners in developing informed strategies to address nitrogen loading to coastal water bodies of Long Island, New York. Coastal water bodies of Long Island are important economic and recreational resources for the region. Therefore, the U.S. Geological Survey and New York State Department of Environmental Conservation initiated a program to delineate a comprehensive dataset of CAs (or areas contributing groundwater), travel times, and groundwater discharges to streams, lakes, marine-surface waters, and subsea discharge boundaries. The 25-layer regional groundwater-flow...
Layered geospatial PDF 7.5 Minute Quadrangle Map. Layers of geospatial data include orthoimagery, roads, grids, geographic names, elevation contours, hydrography, and other selected map features. This map is derived from GIS (geospatial information system) data. It represents a repackaging of GIS data in traditional map form, not creation of new information. The geospatial data in this map are from selected National Map data holdings and other government sources.
Layered geospatial PDF 7.5 Minute Quadrangle Map. Layers of geospatial data include orthoimagery, roads, grids, geographic names, elevation contours, hydrography, and other selected map features. This map is derived from GIS (geospatial information system) data. It represents a repackaging of GIS data in traditional map form, not creation of new information. The geospatial data in this map are from selected National Map data holdings and other government sources.
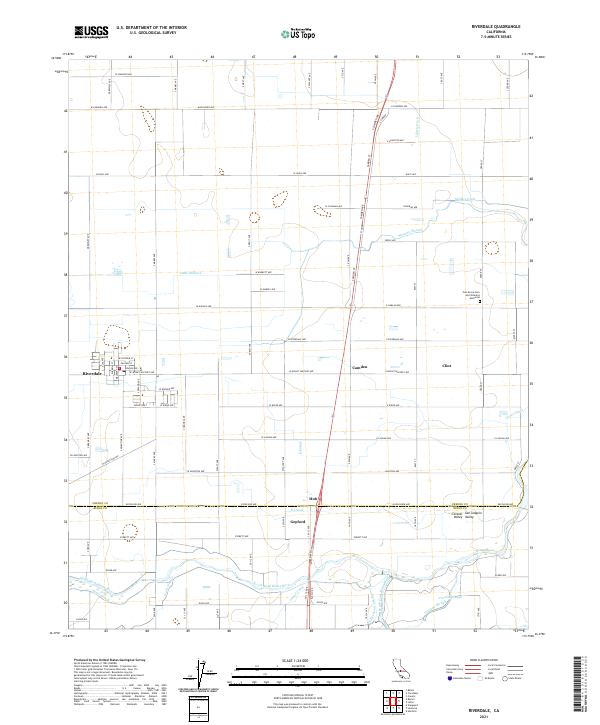
Layered geospatial PDF 7.5 Minute Quadrangle Map. Layers of geospatial data include orthoimagery, roads, grids, geographic names, elevation contours, hydrography, and other selected map features. This map is derived from GIS (geospatial information system) data. It represents a repackaging of GIS data in traditional map form, not creation of new information. The geospatial data in this map are from selected National Map data holdings and other government sources.
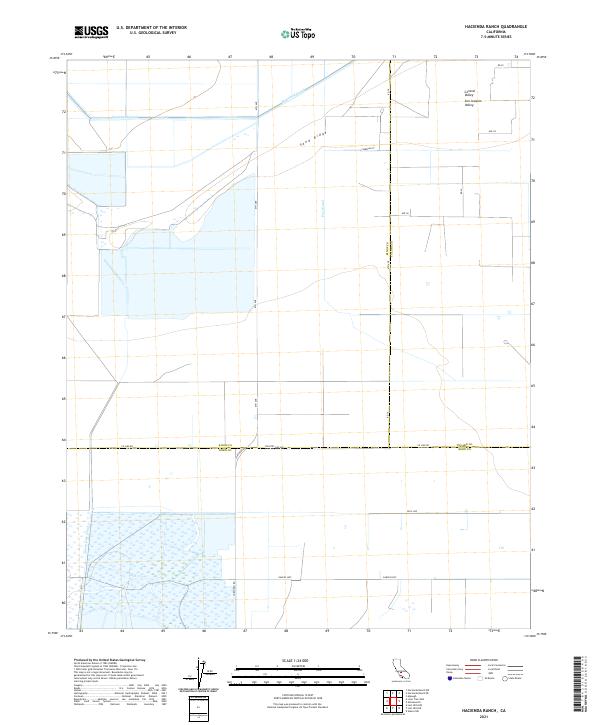
Layered geospatial PDF 7.5 Minute Quadrangle Map. Layers of geospatial data include orthoimagery, roads, grids, geographic names, elevation contours, hydrography, and other selected map features. This map is derived from GIS (geospatial information system) data. It represents a repackaging of GIS data in traditional map form, not creation of new information. The geospatial data in this map are from selected National Map data holdings and other government sources.
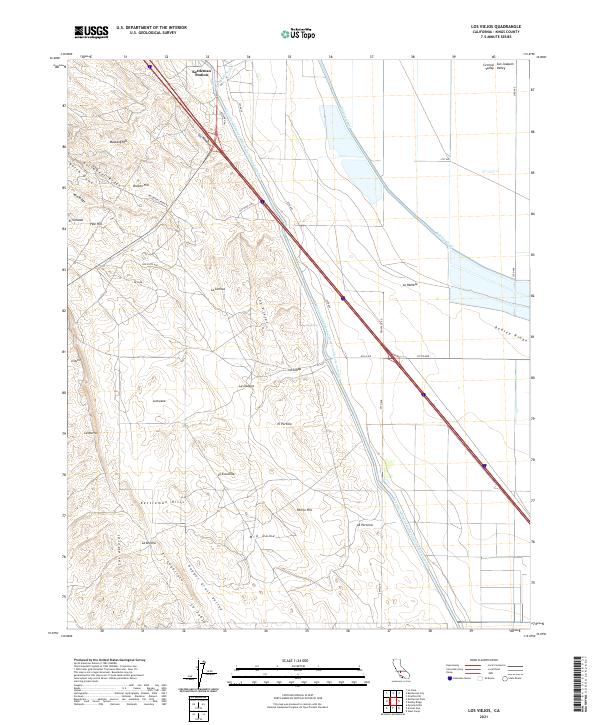
Layered geospatial PDF 7.5 Minute Quadrangle Map. Layers of geospatial data include orthoimagery, roads, grids, geographic names, elevation contours, hydrography, and other selected map features. This map is derived from GIS (geospatial information system) data. It represents a repackaging of GIS data in traditional map form, not creation of new information. The geospatial data in this map are from selected National Map data holdings and other government sources.
|

|
