Filters: Tags: Land cover (X)
815 results (53ms)|
Filters
Date Range
Extensions (Less)
Types (Less)
Contacts (Less)
Categories (Less)
Tag Types
|
The US Geological Survey Chesapeake Bay Watershed Land Cover Data Series, 2011 edition, (CBLCD-e11) consists of Level I Land Cover data for the years 1984, 1992, 2001, 2006 and 2011. It consists of a series of five 8-bit unsigned integer raster data files of 30 meter spatial resolution in Albers Conic Equal Area projection, NAD83 datum. The 1984 – 2006 data layers were created by aggregating most Level II Anderson classes of the USGS CBLCD Land Cover Data Series released in 2010 (Irani and Claggett, 2010).
This data set presents attributes of floodplain ecosystem characteristics including floodplain soil denitrification, floodplain soil biogeochemistry, floodplain vegetation, floodplain sedimentation, floodplain and channel morphometry, stream discharge and water quality, floodplain climate, floodplain physiographic region, and catchment land cover. Attributes are associated with 18 floodplains of the Chesapeake Bay watershed. For many of these attributes, mean values are summaries of multiple measurements made within each floodplain site.
Categories: Data;
Tags: Maryland,
Pennsylvania,
USGS Science Data Catalog (SDC),
Virginia,
West Virginia,
This raster dataset depicts percent canopy cover derived from 1-m conifer classifications when aggregated to 30-m cells. Conifer features were classified from 2010, 2012, and 2013 NAIP Digital Ortho Quarter Quads (DOQQ) using the Feature Analyst 5.0 extension for ArcGIS 10.1. Tiles were organized and grouped by Nevada Department of Wildlife Population Management Unit (PMU) locations, plus a 10 km area beyond the PMU extent. Analysts visually identified conifers in the imagery using false color infrared settings and digitized multiple trees per tile as training locations for classification. After performing hierarchical learning and clutter removal with Feature Analyst to remove non-conifer features on output shapefiles,...
Types: Citation,
Map Service,
OGC WFS Layer,
OGC WMS Layer,
OGC WMS Service;
Tags: Biota,
Conifers,
Environment,
Great Basin,
Land cover,
Geospatial data that is a derivative land cover product depicting woodland on topographic maps.
The national dataset was clipped to the WLCI envelope by USGS staff. No other processing was performed on the dataset. This map layer is commonly called Bailey's ecoregions and shows ecosystems of regional extent in the United States, Puerto Rico, and the U.S. Virgin Islands. Four levels of detail are included to show a hierarchy of ecosystems. The largest ecosystems are domains, which are groups of related climates and which are differentiated based on precipitation and temperature. Divisions represent the climates within domains and are differentiated based on precipitation levels and patterns as well as temperature. Divisions are subdivided into provinces, which are differentiated based on vegetation or other...
Categories: Data;
Types: Downloadable,
Map Service,
OGC WFS Layer,
OGC WMS Layer,
Shapefile;
Tags: acid rain,
animal/plant,
biotic,
ecosystem,
elevation,
This data file contains a list of journal articles found in a recent search for research relevant to studying landscape perceptions. We collected all peer reviewed academic articles containing the keywords “landscape” and “perception” on the web of science resulting in 3497 records. To eliminate studies not directly addressing landscape perception we filtered out medical journal articles (n=1211). We also chose to limit our assessment to journals directly concerned with the landscape perception topic, omitting those with fewer than 5 articles pertaining to these keywords (n=1044). The abstract and title of the remaining articles (n=1242) were further scanned to discard irrelevant studies and evaluate specific methods...
Categories: Data;
Tags: Geography,
Land Use Change,
USGS Science Data Catalog (SDC),
World,
land cover,
This dataset contains a projection of land use and land cover for the conterminous United States for the period 2001 - 2061. This projection used the USGS's LUCAS (Land Use and Carbon Scenario Simulator) model to project a business as usual scenario of land cover and land use change. By running the LUCAS model on the USGS's YETI high performance computer and parallelizing the computation, we ran 100 Monte Carlo simulations based on empirically observed rates of change at a relatively fine scale (270m). We sampled from multiple observed rates of change at the county level to introduce heterogeneity into the Monte Carlo simulations. Using this approach allowed the model to project different outcomes that were summarized...

The USDA, NASS Cropland Data Layer (CDL) is a raster, geo-referenced, crop-specific land cover data layer with a ground resolution of 56 meters. The CDL is produced using satellite imagery from the Indian Remote Sensing RESOURCESAT-1 (IRS-P6) Advanced Wide Field Sensor (AWiFS) collected during the current growing season. Some Cropland Data Layer states used Landsat 5 TM and/or Landsat 7 ETM+ satellite imagery to supplement the classification. Ancillary classification inputs include: the United States Geological Survey (USGS) National Elevation Dataset (NED), the USGS National Land Cover Dataset 2001 (NLCD 2001), and the National Aeronautics and Space Administration (NASA) Moderate Resolution Imaging Spectroradiometer...

Geospatial data that is a derivative land cover product depicting woodland on topographic maps.
Geospatial data that is a derivative land cover product depicting woodland on topographic maps.
Geospatial data that is a derivative land cover product depicting woodland on topographic maps.
Geospatial data that is a derivative land cover product depicting woodland on topographic maps.
Geospatial data that is a derivative land cover product depicting woodland on topographic maps.
Geospatial data that is a derivative land cover product depicting woodland on topographic maps.
Geospatial data that is a derivative land cover product depicting woodland on topographic maps.
Geospatial data that is a derivative land cover product depicting woodland on topographic maps.
Geospatial data that is a derivative land cover product depicting woodland on topographic maps.
Geospatial data that is a derivative land cover product depicting woodland on topographic maps.
Four regional land cover datasets, of varying spatial and classification resolution, were used as the source data for the AKNHP land cover mosaic. These data are provided by Bureau of Land Management (BLM) "as is" and may contain errors or omissions. The User assumes the entire risk associated with its use of these data and bears all responsibility in determining whether these data are fit for the User's intended use. These data may not have the accuracy, resolution, completeness, timeliness, or other characteristics appropriate for applications that potential users of the data may contemplate. The User is encouraged to carefully consider the content of the metadata file associated with these data. The BLM should...
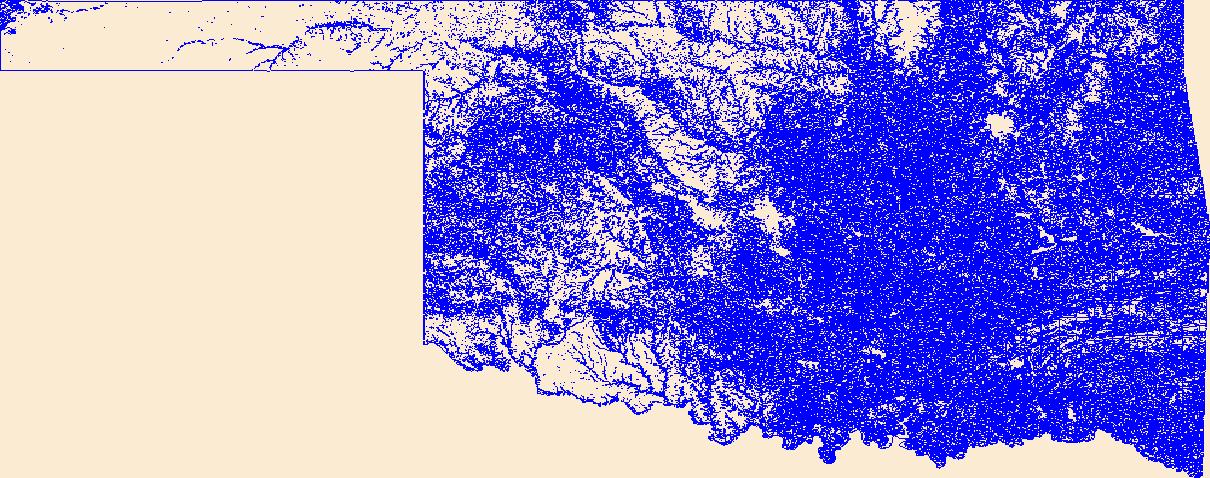
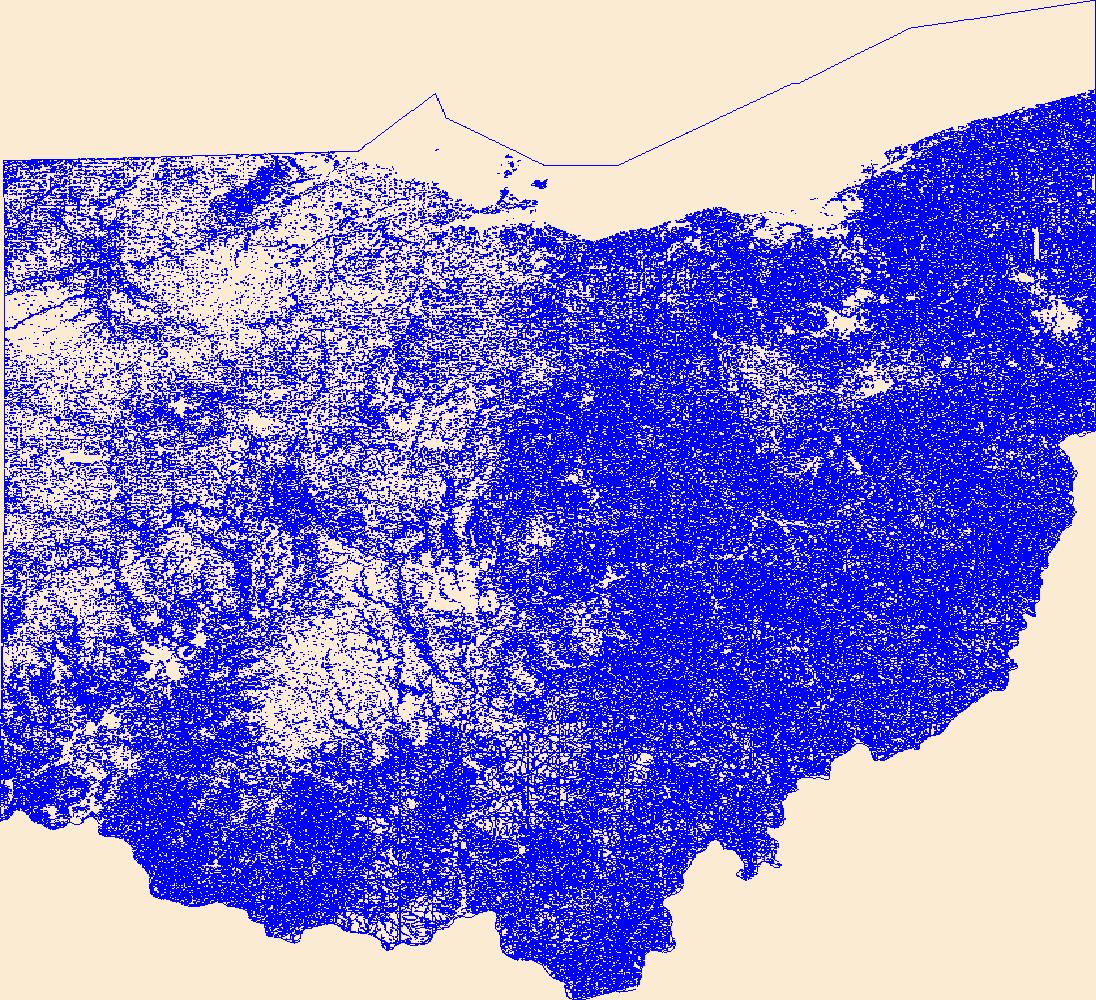
The NHDPlus Version 1.0 is an integrated suite of application-ready geospatial data sets that incorporate many of the best features of the National Hydrography Dataset (NHD) and the National Elevation Dataset (NED). The NHDPlus includes a stream network (based on the 1:100,000-scale NHD), improved networking, naming, and "value-added attributes" (VAA's). NHDPlus also includes elevation-derived catchments (drainage areas) produced using a drainage enforcement technique first broadly applied in New England, and thus dubbed "The New-England Method". This technique involves "burning-in" the 1:100,000-scale NHD and when available building "walls" using the national Watershed Boundary Dataset (WBD). The resulting modified...
|

|
