Filters: Tags: Leflore County (X)
58 results (21ms)|
Filters
Date Range
Extensions Types Contacts
Categories Tag Types Tag Schemes |
Surface and water-borne geophysical methods can provide information for the characterization of the subsurface structure of the earth for aquifer investigations. Floating and towed transient electromagnetic (FloaTEM and tTEM) surveys provide resistivity soundings of the subsurface, which can be related to lithology and hydrogeology. In the TEM method, a primary electrical current is cycled through a wire in a transmitter loop (Tx), which in turn produces a static primary magnetic field. When the current in the TX loop is abruptly terminated, secondary electrical currents are induced in the earth that move downward and outward decaying with time. The decay of the secondary electrical field is controlled by the subsurface...
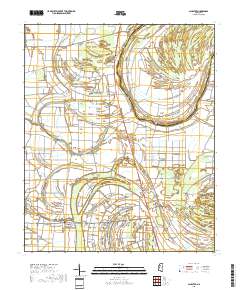
Layered geospatial PDF 7.5 Minute Quadrangle Map. Layers of geospatial data include orthoimagery, roads, grids, geographic names, elevation contours, hydrography, and other selected map features. This map is derived from GIS (geospatial information system) data. It represents a repackaging of GIS data in traditional map form, not creation of new information. The geospatial data in this map are from selected National Map data holdings and other government sources.
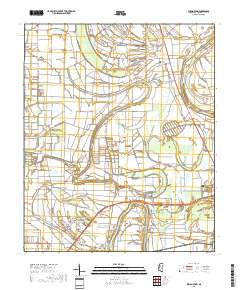
Layered geospatial PDF 7.5 Minute Quadrangle Map. Layers of geospatial data include orthoimagery, roads, grids, geographic names, elevation contours, hydrography, and other selected map features. This map is derived from GIS (geospatial information system) data. It represents a repackaging of GIS data in traditional map form, not creation of new information. The geospatial data in this map are from selected National Map data holdings and other government sources.
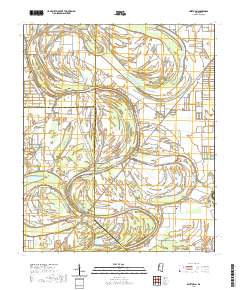
Layered geospatial PDF 7.5 Minute Quadrangle Map. Layers of geospatial data include orthoimagery, roads, grids, geographic names, elevation contours, hydrography, and other selected map features. This map is derived from GIS (geospatial information system) data. It represents a repackaging of GIS data in traditional map form, not creation of new information. The geospatial data in this map are from selected National Map data holdings and other government sources.
Layered geospatial PDF 7.5 Minute Quadrangle Map. Layers of geospatial data include orthoimagery, roads, grids, geographic names, elevation contours, hydrography, and other selected map features. This map is derived from GIS (geospatial information system) data. It represents a repackaging of GIS data in traditional map form, not creation of new information. The geospatial data in this map are from selected National Map data holdings and other government sources.
Layered geospatial PDF 7.5 Minute Quadrangle Map. Layers of geospatial data include orthoimagery, roads, grids, geographic names, elevation contours, hydrography, and other selected map features. This map is derived from GIS (geospatial information system) data. It represents a repackaging of GIS data in traditional map form, not creation of new information. The geospatial data in this map are from selected National Map data holdings and other government sources.
Layered geospatial PDF 7.5 Minute Quadrangle Map. Layers of geospatial data include orthoimagery, roads, grids, geographic names, elevation contours, hydrography, and other selected map features. This map is derived from GIS (geospatial information system) data. It represents a repackaging of GIS data in traditional map form, not creation of new information. The geospatial data in this map are from selected National Map data holdings and other government sources.
Layered geospatial PDF 7.5 Minute Quadrangle Map. Layers of geospatial data include orthoimagery, roads, grids, geographic names, elevation contours, hydrography, and other selected map features. This map is derived from GIS (geospatial information system) data. It represents a repackaging of GIS data in traditional map form, not creation of new information. The geospatial data in this map are from selected National Map data holdings and other government sources.
Layered geospatial PDF 7.5 Minute Quadrangle Map. Layers of geospatial data include orthoimagery, roads, grids, geographic names, elevation contours, hydrography, and other selected map features. This map is derived from GIS (geospatial information system) data. It represents a repackaging of GIS data in traditional map form, not creation of new information. The geospatial data in this map are from selected National Map data holdings and other government sources.
Airborne electromagnetic (AEM), magnetic, and radiometric data were acquired in late February to early March 2018 along 2,364 line-kilometers in the Shellmound, Mississippi study area. Data were acquired by CGG Canada Services, Ltd. with three different helicopter-borne sensors: the CGG Canada Services, Ltd. RESOLVE frequency-domain AEM instrument that is used to map subsurface geologic structure at depths up to 100 meters, depending on the subsurface resistivity; a Scintrex CS-3 cesium vapor magnetometer that detects changes in deep (hundreds of meters to kilometers) geologic structure based on variations in the magnetic properties of different formations; and a Radiation Solutions RS-500 spectrometer that detects...
Categories: Data;
Tags: GGGSC,
Geology, Geophysics, and Geochemistry Science Center,
Greenwood,
Leflore County,
MRVA,
Airborne electromagnetic (AEM), magnetic, and radiometric data were acquired in late February to early March 2018 along 2,364 line-kilometers in the Shellmound, Mississippi study area. Data were acquired by CGG Canada Services, Ltd. with three different helicopter-borne sensors: the CGG Canada Services, Ltd. RESOLVE frequency-domain AEM instrument that is used to map subsurface geologic structure at depths up to 100 meters, depending on the subsurface resistivity; a Scintrex CS-3 cesium vapor magnetometer that detects changes in deep (hundreds of meters to kilometers) geologic structure based on variations in the magnetic properties of different formations; and a Radiation Solutions RS-500 spectrometer that detects...
Towed transient electromagnetic (tTEM) data were acquired adjacent to the Tallahatchie River during March 2018. During the survey, approximately 35 line-kilometers were collected in the Shellmound, Mississippi study area. Data were collected by members of the U.S. Geological Survey, Hydrogeophysics Branch, and the Aarhus University HydroGeophysics Group. FloaTEM data acquired near the Tallahatchie River in Leflore County, in Mississippi, were collected to characterize the subsurface resistivity structure in support of a U.S. Geological Survey groundwater investigation of the Mississippi Alluvial Plain. tTEM data were collected using an Aarhus University HydroGeophysics Group tTEM unit using a transmitter loop (Tx)...
Layered geospatial PDF 7.5 Minute Quadrangle Map. Layers of geospatial data include orthoimagery, roads, grids, geographic names, elevation contours, hydrography, and other selected map features. This map is derived from GIS (geospatial information system) data. It represents a repackaging of GIS data in traditional map form, not creation of new information. The geospatial data in this map are from selected National Map data holdings and other government sources.
Layered geospatial PDF 7.5 Minute Quadrangle Map. Layers of geospatial data include orthoimagery, roads, grids, geographic names, elevation contours, hydrography, and other selected map features. This map is derived from GIS (geospatial information system) data. It represents a repackaging of GIS data in traditional map form, not creation of new information. The geospatial data in this map are from selected National Map data holdings and other government sources.
Layered geospatial PDF 7.5 Minute Quadrangle Map. Layers of geospatial data include orthoimagery, roads, grids, geographic names, elevation contours, hydrography, and other selected map features. This map is derived from GIS (geospatial information system) data. It represents a repackaging of GIS data in traditional map form, not creation of new information. The geospatial data in this map are from selected National Map data holdings and other government sources.
Towed transient electromagnetic (tTEM) data were acquired at two field locations near Shellmound, Mississippi during March 2018. During the survey, approximately 34.7 line-kilometers were collected in the study area. Data were collected by members of the U.S. Geological Survey, Hydrogeophysics Branch, and the Aarhus University Hydrogeophysics Group. tTEM data acquired along the approximately 35-line kilometers in two agricultural fields near the banks of the Tallahatchie River in Leflore County, Mississippi. Data were collected to characterize the subsurface resistivity structure in support of a U.S. Geological Survey groundwater investigation of the Mississippi Alluvial Plain. tTEM data were collected using an...
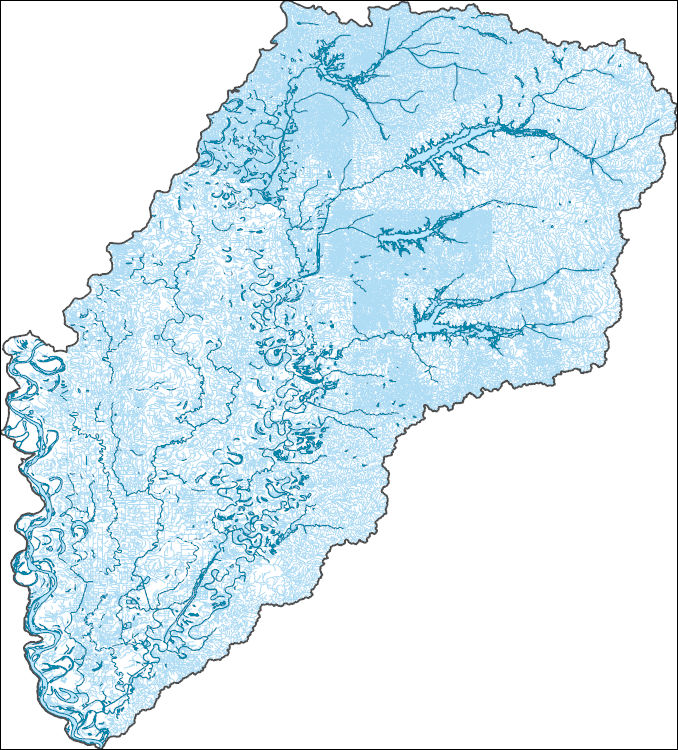
The High Resolution National Hydrography Dataset Plus (NHDPlus HR) is an integrated set of geospatial data layers, including the best available National Hydrography Dataset (NHD), the 10-meter 3D Elevation Program Digital Elevation Model (3DEP DEM), and the National Watershed Boundary Dataset (WBD). The NHDPlus HR combines the NHD, 3DEP DEMs, and WBD to create a stream network with linear referencing, feature naming, "value added attributes" (VAAs), elevation-derived catchments, and other features for hydrologic data analysis. The stream network with linear referencing is a system of data relationships applied to hydrographic systems so that one stream reach "flows" into another and "events" can be tied to and traced...
Layered geospatial PDF 7.5 Minute Quadrangle Map. Layers of geospatial data include orthoimagery, roads, grids, geographic names, elevation contours, hydrography, and other selected map features. This map is derived from GIS (geospatial information system) data. It represents a repackaging of GIS data in traditional map form, not creation of new information. The geospatial data in this map are from selected National Map data holdings and other government sources.
Layered geospatial PDF 7.5 Minute Quadrangle Map. Layers of geospatial data include orthoimagery, roads, grids, geographic names, elevation contours, hydrography, and other selected map features. This map is derived from GIS (geospatial information system) data. It represents a repackaging of GIS data in traditional map form, not creation of new information. The geospatial data in this map are from selected National Map data holdings and other government sources.
Layered geospatial PDF 7.5 Minute Quadrangle Map. Layers of geospatial data include orthoimagery, roads, grids, geographic names, elevation contours, hydrography, and other selected map features. This map is derived from GIS (geospatial information system) data. It represents a repackaging of GIS data in traditional map form, not creation of new information. The geospatial data in this map are from selected National Map data holdings and other government sources.
|

|
