Filters: Tags: Linn County (X) > Date Range: {"choice":"year"} (X)
14 results (202ms)|
Filters
Date Types (for Date Range)
Categories Tag Types Tag Schemes |
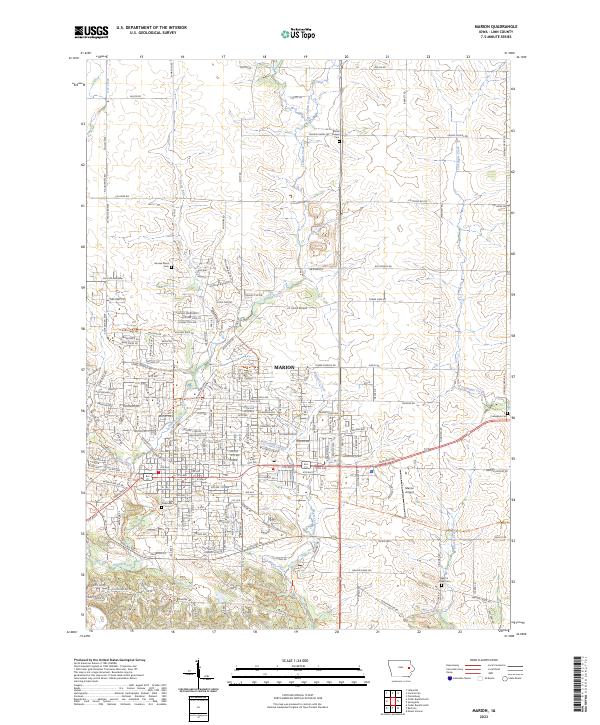
Layered geospatial PDF 7.5 Minute Quadrangle Map. Layers of geospatial data include orthoimagery, roads, grids, geographic names, elevation contours, hydrography, and other selected map features. This map is derived from GIS (geospatial information system) data. It represents a repackaging of GIS data in traditional map form, not creation of new information. The geospatial data in this map are from selected National Map data holdings and other government sources.
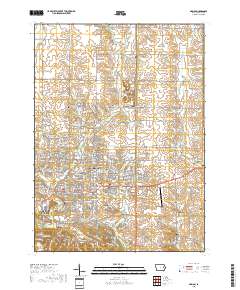
Layered geospatial PDF 7.5 Minute Quadrangle Map. Layers of geospatial data include orthoimagery, roads, grids, geographic names, elevation contours, hydrography, and other selected map features. This map is derived from GIS (geospatial information system) data. It represents a repackaging of GIS data in traditional map form, not creation of new information. The geospatial data in this map are from selected National Map data holdings and other government sources.

A three-dimensional MODFLOW-NWT model was constructed to better understand the effects of drought stress on the Cedar River alluvial aquifer, the principal source of municipal water for the City of Cedar Rapids, Iowa. Historically, the aquifer supported the production needs of the City of Cedar Rapids and surrounding area but between July 2011 and February 2013, Iowa experienced severe drought conditions that affected water availability for communities that relied on alluvial aquifers for their production needs. During that time, the City of Cedar Rapids observed water level declines in their horizontal collector wells (HCW) of as much as about 11 meters. Pumping from affected production wells had to be halted to...
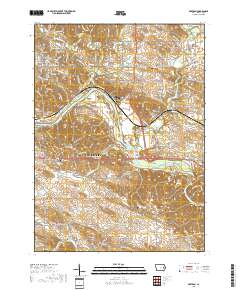
Layered geospatial PDF 7.5 Minute Quadrangle Map. Layers of geospatial data include orthoimagery, roads, grids, geographic names, elevation contours, hydrography, and other selected map features. This map is derived from GIS (geospatial information system) data. It represents a repackaging of GIS data in traditional map form, not creation of new information. The geospatial data in this map are from selected National Map data holdings and other government sources.
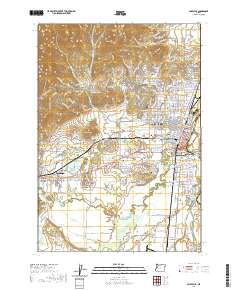
Layered geospatial PDF 7.5 Minute Quadrangle Map. Layers of geospatial data include orthoimagery, roads, grids, geographic names, elevation contours, hydrography, and other selected map features. This map is derived from GIS (geospatial information system) data. It represents a repackaging of GIS data in traditional map form, not creation of new information. The geospatial data in this map are from selected National Map data holdings and other government sources.
Water supply lakes are the primary source of water for many communities in northern and western Missouri. Therefore, accurate and up-to-date estimates of lake capacity are important for managing and predicting adequate water supply. Many of the water supply lakes in Missouri were previously surveyed by the U.S. Geological Survey in the early 2000s (Richards, 2013) and in 2013 (Huizinga, 2014); however, years of potential sedimentation may have resulted in reduced water storage capacity. Periodic bathymetric surveys are useful to update the area/capacity table and to determine changes in the bathymetric surface. Brookfield City Lake is a water supply lake used by the city of Brookfield in north-central Missouri....
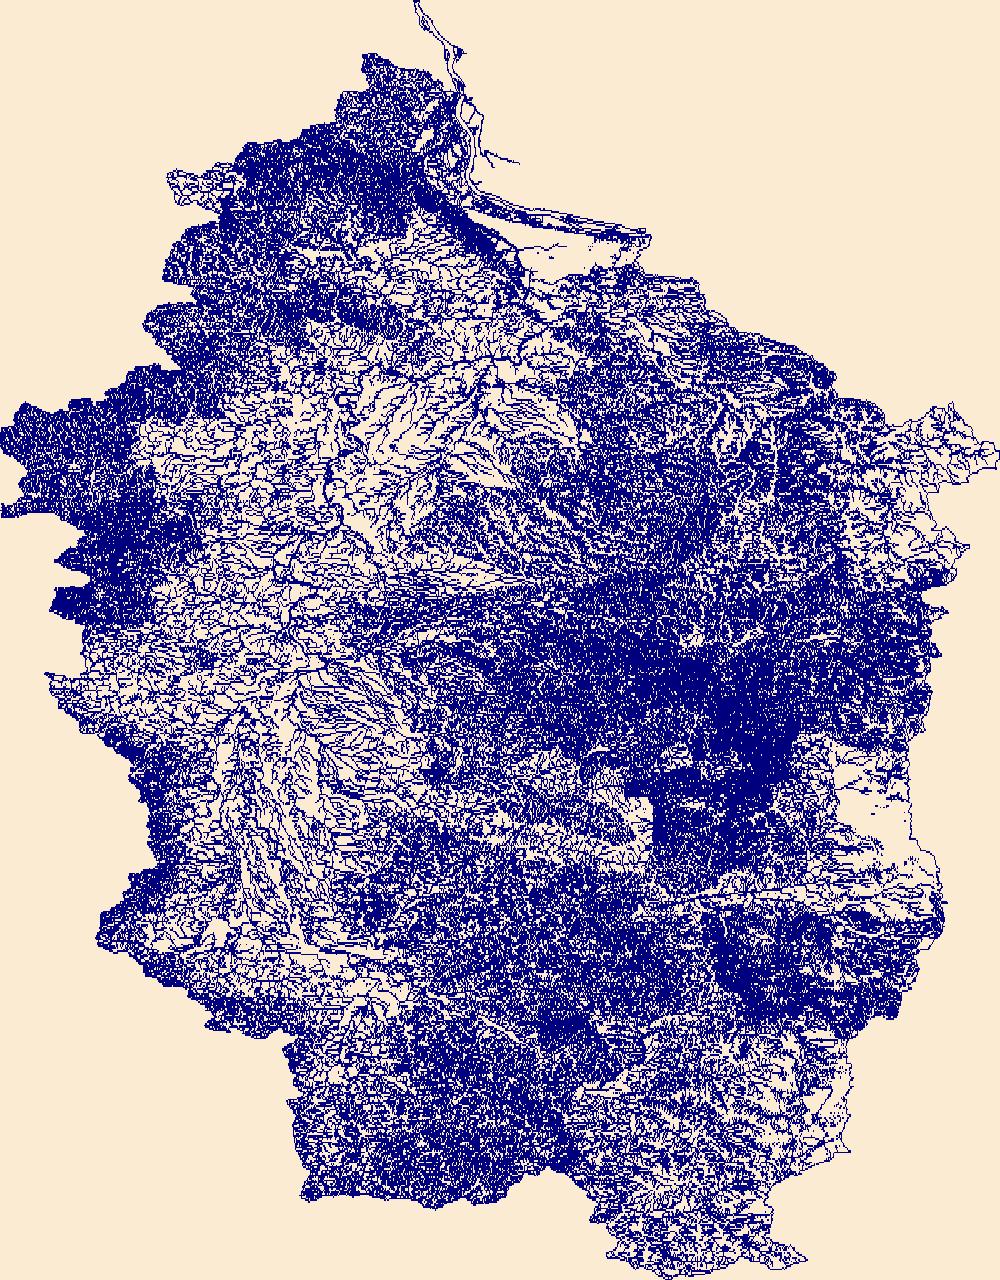
The High Resolution National Hydrography Dataset Plus (NHDPlus HR) is an integrated set of geospatial data layers, including the best available National Hydrography Dataset (NHD), the 10-meter 3D Elevation Program Digital Elevation Model (3DEP DEM), and the National Watershed Boundary Dataset (WBD). The NHDPlus HR combines the NHD, 3DEP DEMs, and WBD to create a stream network with linear referencing, feature naming, "value added attributes" (VAAs), elevation-derived catchments, and other features for hydrologic data analysis. The stream network with linear referencing is a system of data relationships applied to hydrographic systems so that one stream reach "flows" into another and "events" can be tied to and traced...
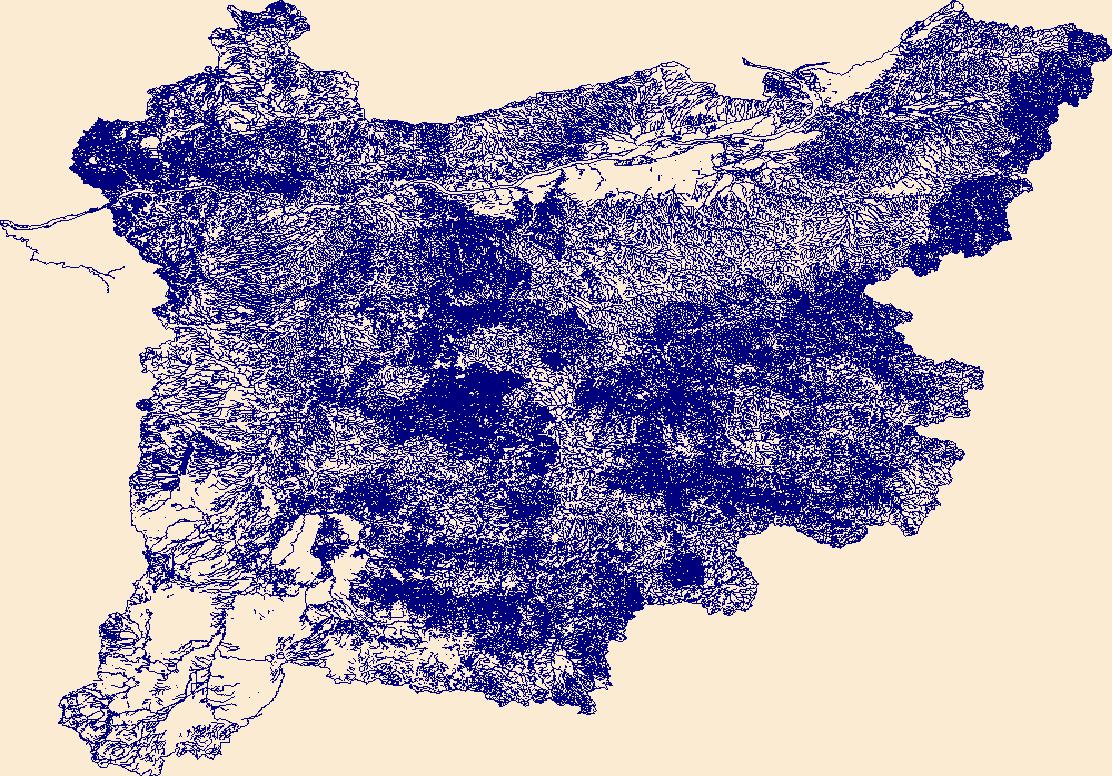
The High Resolution National Hydrography Dataset Plus (NHDPlus HR) is an integrated set of geospatial data layers, including the best available National Hydrography Dataset (NHD), the 10-meter 3D Elevation Program Digital Elevation Model (3DEP DEM), and the National Watershed Boundary Dataset (WBD). The NHDPlus HR combines the NHD, 3DEP DEMs, and WBD to create a stream network with linear referencing, feature naming, "value added attributes" (VAAs), elevation-derived catchments, and other features for hydrologic data analysis. The stream network with linear referencing is a system of data relationships applied to hydrographic systems so that one stream reach "flows" into another and "events" can be tied to and traced...
In the Willamette River Basin in northwestern Oregon, stream temperature has been altered by 13 dams operated by the U.S. Army Corps of Engineers (USACE), negatively influencing threatened populations of native salmonids. CE-QUAL-W2, a two-dimensional, hydrodynamic water quality model, has been used to investigate temperature and heat patterns in the Willamette River and the downstream effects of dam operations and other anthropogenic effects on heat and stream temperature. This data release includes the input and output files for six CE-QUAL-W2 models that include Fall Creek downstream of Fall Creek Dam, the Row River downstream of Dorena Dam, the Coast Fork Willamette River downstream of Cottage Grove Dam, the...
Categories: Data Release - Revised;
Tags: Benton County,
CE-QUAL-W2 model,
Clackamas County,
Coast Fork Willamette River,
Fall Creek,
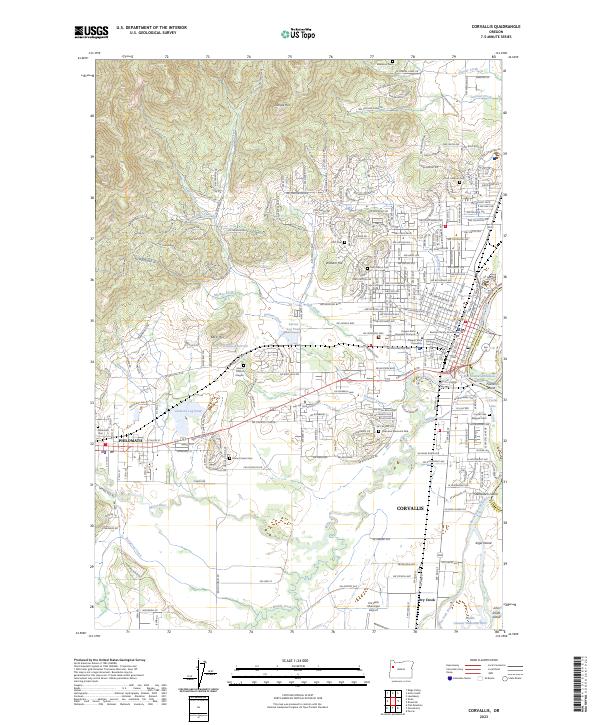
Layered geospatial PDF 7.5 Minute Quadrangle Map. Layers of geospatial data include orthoimagery, roads, grids, geographic names, elevation contours, hydrography, and other selected map features. This map is derived from GIS (geospatial information system) data. It represents a repackaging of GIS data in traditional map form, not creation of new information. The geospatial data in this map are from selected National Map data holdings and other government sources.
Water supply lakes are the primary source of water for many communities in northern and western Missouri. Therefore, accurate and up-to-date estimates of lake capacity are important for managing and predicting adequate water supply. Many of the water supply lakes in Missouri were previously surveyed by the U.S. Geological Survey in the early 2000s (Richards, 2013) and in 2013 (Huizinga, 2014); however, years of potential sedimentation may have resulted in reduced water storage capacity. Periodic bathymetric surveys are useful to update the area/capacity table and to determine changes in the bathymetric surface. Marceline Old Reservoir is a water supply lake used by the city of Marceline in north-central Missouri....
Water supply lakes are the primary source of water for many communities in northern and western Missouri. Therefore, accurate and up-to-date estimates of lake capacity are important for managing and predicting adequate water supply. Many of the water supply lakes in Missouri were previously surveyed by the U.S. Geological Survey in the early 2000s (Richards, 2013) and in 2013 (Huizinga, 2014); however, years of potential sedimentation may have resulted in reduced water storage capacity. Periodic bathymetric surveys are useful to update the area/capacity table and to determine changes in the bathymetric surface. From March to May 2021, the U.S. Geological Survey, in cooperation with the Missouri Department of Natural...
The US Fish and Wildlife Service (USFWS) is evaluating the status of the Cascade torrent salamander (Rhyacotriton cascadae) across its range to determine whether the species merits listing under the Endangered Species Act. The USGS conducted visual surveys for Rhyacotriton cascadae at 65 sites in Oregon and Washington that were historically occupied by the species. Sites were selected from a pool of historic records that had high locational precision, were spatially independent, and were stratified across 8 subbasins identified by USFWS as priorities. We visited sites one to two times between 4 May and 12 October in 2022 and documented all amphibian species observed during 1 hour time-constrained surveys. We also...
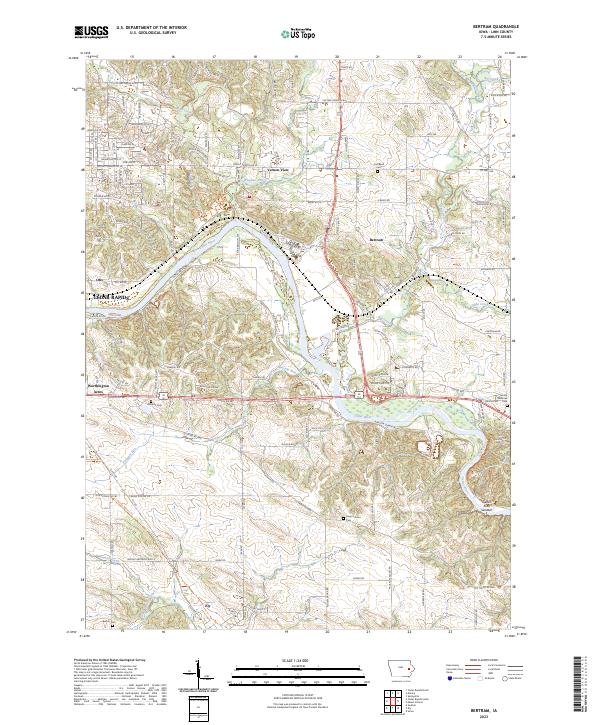
Layered geospatial PDF 7.5 Minute Quadrangle Map. Layers of geospatial data include orthoimagery, roads, grids, geographic names, elevation contours, hydrography, and other selected map features. This map is derived from GIS (geospatial information system) data. It represents a repackaging of GIS data in traditional map form, not creation of new information. The geospatial data in this map are from selected National Map data holdings and other government sources.
|

|
