Filters: Tags: McHenry County (X) > Date Range: {"choice":"year"} (X)
8 results (71ms)|
Filters
Date Types (for Date Range)
Tag Types Tag Schemes |
Data were collected at 19 groundwater monitoring wells and 3 surface water locations across McHenry County, Illinois, in 2020 by staff from the U.S. Geological Survey (USGS) Central Midwest Water Science Center. Quality control samples (2 blanks and 1 replicate) were also collected to assess data reliability and precision. Samples were submitted to the USGS National Water Quality Laboratory in Denver, Colorado, and analyzed for per- and polyfluoroalkyl (PFAS) substances in late 2022 and results provided in April of 2023. PFAS were detected in 16 of the 19 groundwater monitoring wells and in all 3 surface water sites sampled.
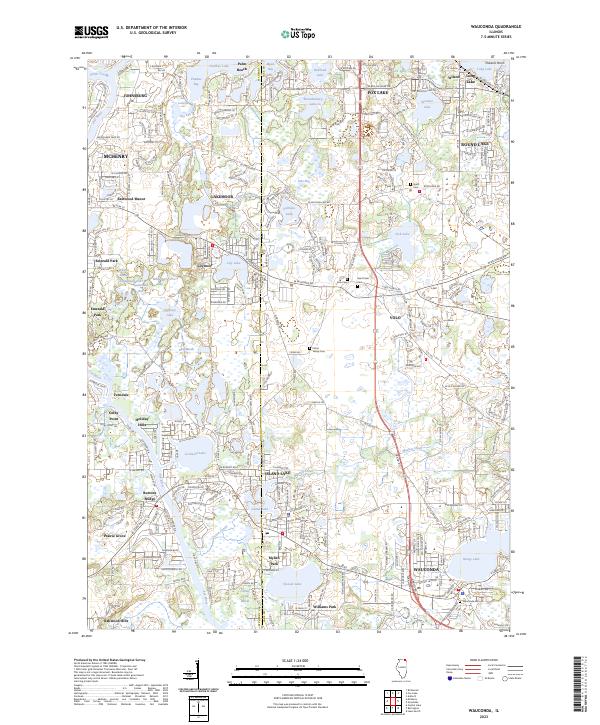
Layered geospatial PDF 7.5 Minute Quadrangle Map. Layers of geospatial data include orthoimagery, roads, grids, geographic names, elevation contours, hydrography, and other selected map features. This map is derived from GIS (geospatial information system) data. It represents a repackaging of GIS data in traditional map form, not creation of new information. The geospatial data in this map are from selected National Map data holdings and other government sources.
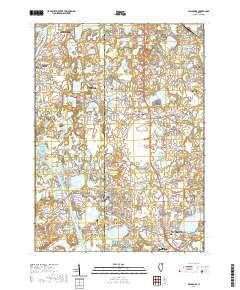
Layered geospatial PDF 7.5 Minute Quadrangle Map. Layers of geospatial data include orthoimagery, roads, grids, geographic names, elevation contours, hydrography, and other selected map features. This map is derived from GIS (geospatial information system) data. It represents a repackaging of GIS data in traditional map form, not creation of new information. The geospatial data in this map are from selected National Map data holdings and other government sources.
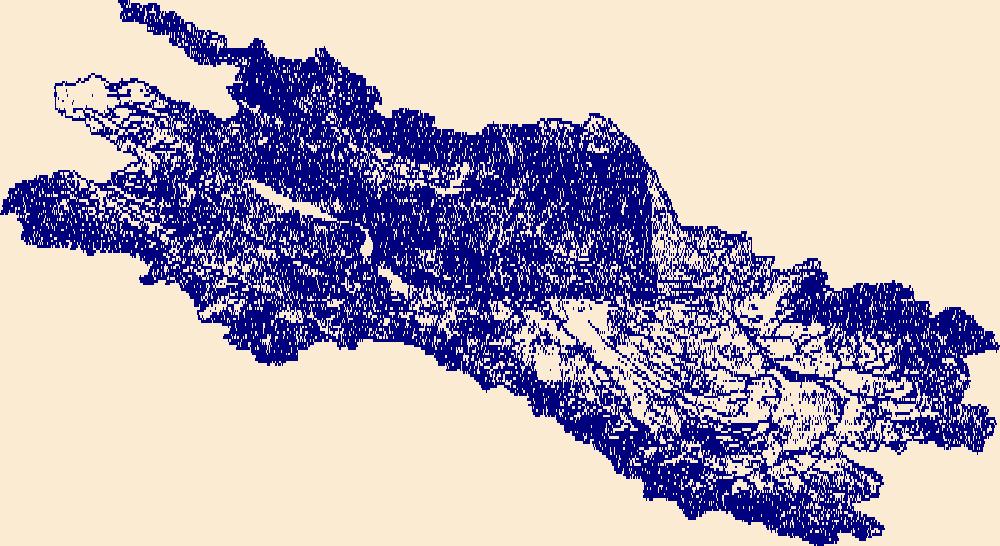
The High Resolution National Hydrography Dataset Plus (NHDPlus HR) is an integrated set of geospatial data layers, including the best available National Hydrography Dataset (NHD), the 10-meter 3D Elevation Program Digital Elevation Model (3DEP DEM), and the National Watershed Boundary Dataset (WBD). The NHDPlus HR combines the NHD, 3DEP DEMs, and WBD to create a stream network with linear referencing, feature naming, "value added attributes" (VAAs), elevation-derived catchments, and other features for hydrologic data analysis. The stream network with linear referencing is a system of data relationships applied to hydrographic systems so that one stream reach "flows" into another and "events" can be tied to and traced...
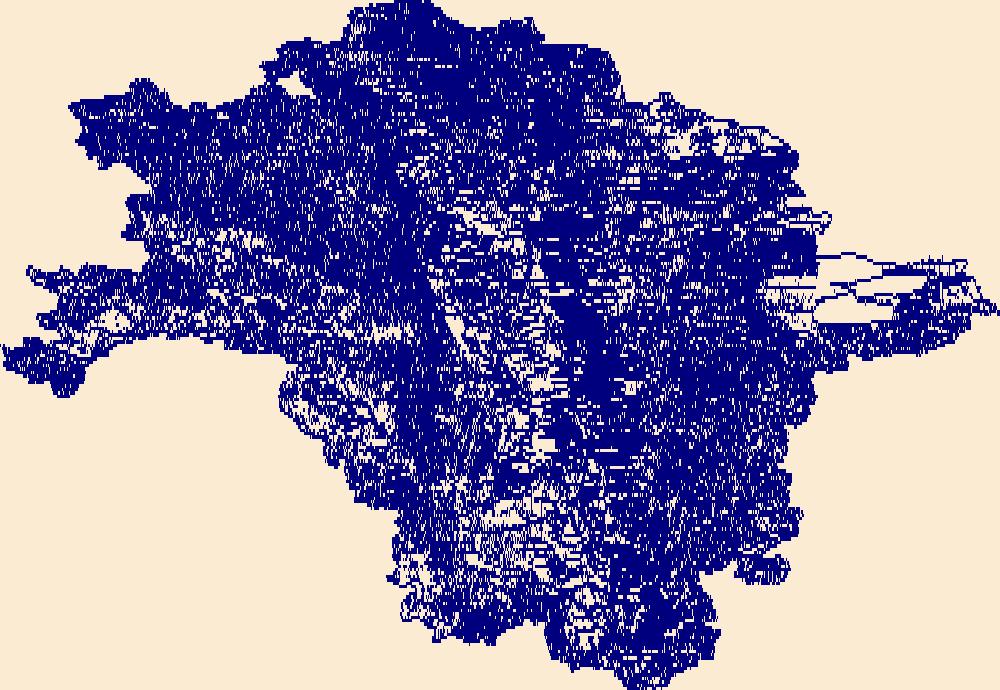
The High Resolution National Hydrography Dataset Plus (NHDPlus HR) is an integrated set of geospatial data layers, including the best available National Hydrography Dataset (NHD), the 10-meter 3D Elevation Program Digital Elevation Model (3DEP DEM), and the National Watershed Boundary Dataset (WBD). The NHDPlus HR combines the NHD, 3DEP DEMs, and WBD to create a stream network with linear referencing, feature naming, "value added attributes" (VAAs), elevation-derived catchments, and other features for hydrologic data analysis. The stream network with linear referencing is a system of data relationships applied to hydrographic systems so that one stream reach "flows" into another and "events" can be tied to and traced...
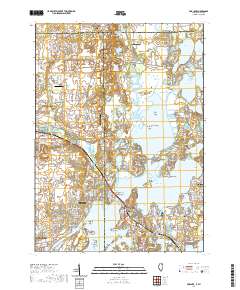
Layered geospatial PDF 7.5 Minute Quadrangle Map. Layers of geospatial data include orthoimagery, roads, grids, geographic names, elevation contours, hydrography, and other selected map features. This map is derived from GIS (geospatial information system) data. It represents a repackaging of GIS data in traditional map form, not creation of new information. The geospatial data in this map are from selected National Map data holdings and other government sources.
A two-dimensional, steady-state groundwater analytic-element flow model, GFLOW (version 2.2.3), was developed to provide a better understanding of the groundwater-surface water interactions of Crystal Lake, in the city of Crystal Lake, Illinois, in response to lowering an outlet weir during current, wet, and dry conditions. Three models were created and calibrated for average 2020 (current) conditions, wet (2017) conditions, and dry (2012) conditions with the current weir elevation and current steady-state stage-flows at the outlet weir. Simulations of groundwater and surface water responses surrounding the lake and lake-water budgets were run to understand the effects and influences of lowering the weir elevation...
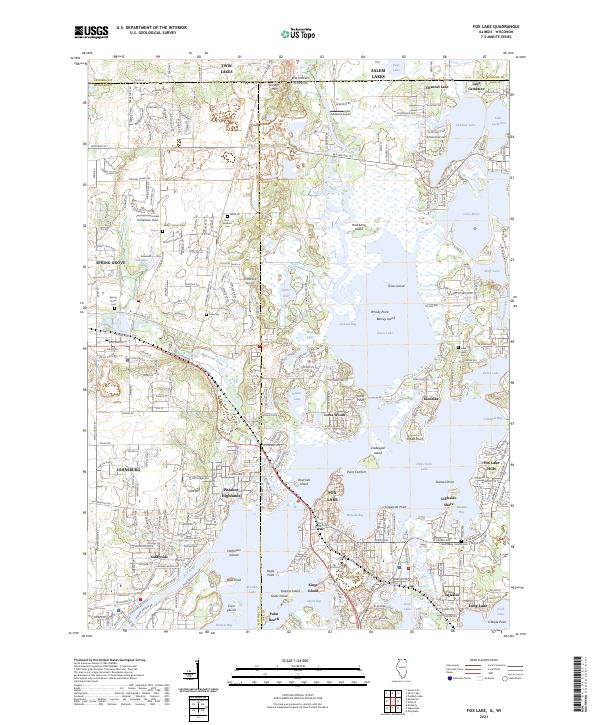
Layered geospatial PDF 7.5 Minute Quadrangle Map. Layers of geospatial data include orthoimagery, roads, grids, geographic names, elevation contours, hydrography, and other selected map features. This map is derived from GIS (geospatial information system) data. It represents a repackaging of GIS data in traditional map form, not creation of new information. The geospatial data in this map are from selected National Map data holdings and other government sources.
|

|
