Filters: Tags: Miami-Dade County (X)
154 results (27ms)|
Filters
Date Range
Extensions Types
Contacts
Categories Tag Types Tag Schemes |
The maximum, and 80th, 90th, and 96th percentiles of the annual maximums of daily water levels recorded at monitoring sites in and near Miami-Dade County, Florida, during the 1974-2009 water years. [≥, greater than or equal to; %, percent; GW, groundwater; NPS, National Park Service; SFWMD, South Florida Water Management District; USGS, U.S. Geological Survey. All data adjusted to the North American Vertical Datum of 1988. Latitude and longitude are in decimal degrees]
Categories: Data;
Types: Citation;
Tags: Biscayne Bay,
Biscayne aquifer,
Contours,
Florida,
Inland Waters,
Statistical analyses and maps representing mean, high, and low water-level conditions in the surface water and groundwater of Miami-Dade County were made by the U.S. Geological Survey, in cooperation with the Miami-Dade County Department of Regulatory and Economic Resources, to help inform decisions necessary for urban planning and development. Sixteen maps were created that show contours of (1) the mean of daily water levels at each site during October and May for the 2000-2009 water years; (2) the 25th, 50th, and 75th percentiles of the daily water levels at each site during October and May and for all months during 2000-2009; and (3) the differences between mean October and May water levels, as well as the differences...
Categories: Data;
Types: Downloadable,
Map Service,
OGC WFS Layer,
OGC WMS Layer,
Shapefile;
Tags: Biscayne Bay,
Biscayne aquifer,
Florida,
Florida Bay,
Miami-Dade County,
Time series electromagnetic induction-log (TSEMIL) datasets are collected from polyvinyl chloride (PVC) cased or uncased monitoring wells to evaluate changes in water conductivity over time. TSEMIL datasets consist of a series of individual electromagnetic induction logs collected at a frequency of months or years that have been compiled into a dataset by eliminating small uniform offsets in bulk conductivity between logs likely caused by minor variations in calibration. At depths where water conductivity is not changing through time, each log is typically within about ±15 mS/m of the median of the dataset at any given depth, which is within the stated repeatability specifications of the probe (Mount Sopris Instrument...
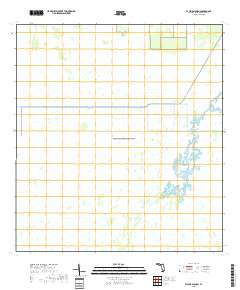
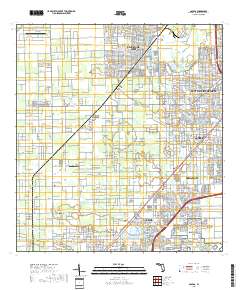
Layered geospatial PDF 7.5 Minute Quadrangle Map. Layers of geospatial data include orthoimagery, roads, grids, geographic names, elevation contours, hydrography, and other selected map features. This map is derived from GIS (geospatial information system) data. It represents a repackaging of GIS data in traditional map form, not creation of new information. The geospatial data in this map are from selected National Map data holdings and other government sources.
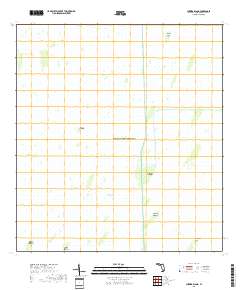
Layered geospatial PDF 7.5 Minute Quadrangle Map. Layers of geospatial data include orthoimagery, roads, grids, geographic names, elevation contours, hydrography, and other selected map features. This map is derived from GIS (geospatial information system) data. It represents a repackaging of GIS data in traditional map form, not creation of new information. The geospatial data in this map are from selected National Map data holdings and other government sources.
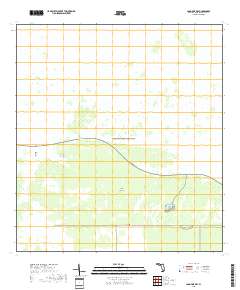
Layered geospatial PDF 7.5 Minute Quadrangle Map. Layers of geospatial data include orthoimagery, roads, grids, geographic names, elevation contours, hydrography, and other selected map features. This map is derived from GIS (geospatial information system) data. It represents a repackaging of GIS data in traditional map form, not creation of new information. The geospatial data in this map are from selected National Map data holdings and other government sources.
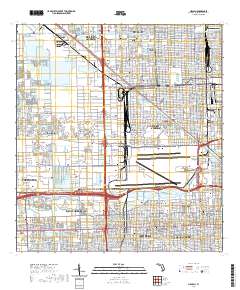
Layered geospatial PDF 7.5 Minute Quadrangle Map. Layers of geospatial data include orthoimagery, roads, grids, geographic names, elevation contours, hydrography, and other selected map features. This map is derived from GIS (geospatial information system) data. It represents a repackaging of GIS data in traditional map form, not creation of new information. The geospatial data in this map are from selected National Map data holdings and other government sources.
Layered geospatial PDF 7.5 Minute Quadrangle Map. Layers of geospatial data include orthoimagery, roads, grids, geographic names, elevation contours, hydrography, and other selected map features. This map is derived from GIS (geospatial information system) data. It represents a repackaging of GIS data in traditional map form, not creation of new information. The geospatial data in this map are from selected National Map data holdings and other government sources.
Layered geospatial PDF 7.5 Minute Quadrangle Map. Layers of geospatial data include orthoimagery, roads, grids, geographic names, elevation contours, hydrography, and other selected map features. This map is derived from GIS (geospatial information system) data. It represents a repackaging of GIS data in traditional map form, not creation of new information. The geospatial data in this map are from selected National Map data holdings and other government sources.
A table summarizing the inventoried acreage by crop type and irrigation system was compiled for Miami-Dade County, Florida. The irrigated acreage totals were derived from analyses of satellite and aerial imagery. Crop types and irrigation system types were later field verified between January 2019 and February 2021. In addition, the table provides acreage totals by crop type reported by the U.S. Department of Commerce for 1982 and the U.S. Department of Agriculture for years between 1987 and 2017.
Categories: Data;
Tags: Crop type,
Florida,
Florida Department of Agriculture and Consumer Services,
Groundwater,
Groundwater,
This is a collection of data on the contamination of water, fish, and sediments in Biscayne National Park and in canals that discharge into the national park. The water data are estimations of their concentrations in water based on sampling with passive water samplers (semi-permeable membrane devices and polar organic chemical integrative samplers). Also in this data set are estrogen equivalencies for the chemical mixtures in the polar organic chemical integrative samplers.
Categories: Data;
Types: Citation;
Tags: Miami-Dade County,
USGS Science Data Catalog (SDC),
semi-permeable membrane device

The Biscayne and Southern Everglades Coastal Transport(BISECT) model combines a three-dimensional groundwater model with a two- dimensional hydrodynamic surface-water model with variable-density solute-transport. BISECT was constructed by combining two existing models, Tides and Inflows to the Mangrove Everglades (TIME) (https://doi.org/10.3133/sir20075010), and Biscayne (https://doi.org/10.3133/sir20125099), and modifying the Flow and Transport in a Linked Overland/Aquifer Density-Dependent System (FTLOADDS) simulator (https://doi.org/10.1016/j.jhydrol.2005.04.015) to include spatially variations in the solar radiation reflected back into the atmosphere from the Earth’s surface (albedo) to improve model results....
This part of the data release presents projected flooding extent polygon shapefiles based on wave-driven total water levels for the State Florida (the Florida Peninsula and the Florida Keys). There are eight associated flood mask and flood depth shapefiles: one for each of four nearshore wave energy return periods (rp; 10-, 50-, 100-, and 500-years), the pre-storm scenario (base) and the post-storm scenarios.
This release of data includes the chloride concentration of water samples provided by the USGS or other organizations that were used for this mapping effort. The inland extent of saltwater at the base of the Biscayne aquifer in the Model Land area of Miami-Dade County, Florida, was mapped in 2011. Since that time, the saltwater interface has continued to move inland. The interface is near several active well fields; therefore, an updated approximation of the inland extent of saltwater and an improved understanding of the rate of movement of the saltwater interface are necessary. A geographic information system was used to create a map using the data collected by the organizations that monitor water salinity in this...
The data set consists of marine seismic-reflection data that includes 34 SEGY data files, navigation data and a CSV format file with a list of files. The archived SEGY files, navigation files, and detailed metadata for these seismic reflections can also be downloaded from the National Archive of Marine Seismic Surveys (NAMSS). https://walrus.wr.usgs.gov/namss//survey/B-1-13-FL/ Marine seismic-reflection data were acquired in canals in eastern Broward County at two different times: February 2010 and April-June 2013, resulting in 34 SEGY data files.
Categories: Data;
Types: Citation,
Map Service,
OGC WFS Layer,
OGC WMS Layer,
OGC WMS Service;
Tags: Broward County,
Geophysics,
Miami-Dade County,
Seismology,
USA,
Layered geospatial PDF 7.5 Minute Quadrangle Map. Layers of geospatial data include orthoimagery, roads, grids, geographic names, elevation contours, hydrography, and other selected map features. This map is derived from GIS (geospatial information system) data. It represents a repackaging of GIS data in traditional map form, not creation of new information. The geospatial data in this map are from selected National Map data holdings and other government sources.
Layered geospatial PDF 7.5 Minute Quadrangle Map. Layers of geospatial data include orthoimagery, roads, grids, geographic names, elevation contours, hydrography, and other selected map features. This map is derived from GIS (geospatial information system) data. It represents a repackaging of GIS data in traditional map form, not creation of new information. The geospatial data in this map are from selected National Map data holdings and other government sources.
Layered geospatial PDF 7.5 Minute Quadrangle Map. Layers of geospatial data include orthoimagery, roads, grids, geographic names, elevation contours, hydrography, and other selected map features. This map is derived from GIS (geospatial information system) data. It represents a repackaging of GIS data in traditional map form, not creation of new information. The geospatial data in this map are from selected National Map data holdings and other government sources.
Statistical analyses and maps representing mean, high, and low water-level conditions in the surface water and groundwater of Miami-Dade County were made by the U.S. Geological Survey, in cooperation with the Miami-Dade County Department of Regulatory and Economic Resources, to help inform decisions necessary for urban planning and development. Sixteen maps were created that show contours of (1) the mean of daily water levels at each site during October and May for the 2000-2009 water years; (2) the 25th, 50th, and 75th percentiles of the daily water levels at each site during October and May and for all months during 2000-2009; and (3) the differences between mean October and May water levels, as well as the differences...
Categories: Data;
Types: Downloadable,
Map Service,
OGC WFS Layer,
OGC WMS Layer,
Shapefile;
Tags: Biscayne Bay,
Biscayne aquifer,
Florida,
Florida Bay,
Miami-Dade County,
|

|
