Filters: Tags: Mineral County (X) > Date Range: {"choice":"year"} (X)
148 results (13ms)|
Filters
Date Types (for Date Range)
Types
Contacts
Categories Tag Types Tag Schemes |

These data were released prior to the October 1, 2016 effective date for the USGS’s policy dictating the review, approval, and release of scientific data as referenced in USGS Survey Manual Chapter 502.8 Fundamental Science Practices: Review and Approval of Scientific Data for Release. This digital data set defines the altitudes of the tops of 16 model layers simulated in the Death Valley regional ground-water flow system (DVRFS) transient flow model. The area simulated by the DVRFS transient ground-water flow model is an approximately 45,000 square-kilometer region of southern Nevada and California. The thickness of model layers is derived by sequentially subtracting the altitudes of the uppermost to the lowermost...

These data were released prior to the October 1, 2016 effective date for the USGS’s policy dictating the review, approval, and release of scientific data as referenced in USGS Survey Manual Chapter 502.8 Fundamental Science Practices: Review and Approval of Scientific Data for Release. This digital data set defines the boundary of the area contributing ground-water flow to the Death Valley regional ground-water flow-system (DVRFS) model domain. The boundary encompasses an approximate 112,000 square-kilometer region and was based on a map of regional potential developed by Bedinger and Harrill (2004). Where possible, the amount of lateral flow across the segments of the DVRFS model boundary from (or to) the contributing...

These data were released prior to the October 1, 2016 effective date for the USGS’s policy dictating the review, approval, and release of scientific data as referenced in USGS Survey Manual Chapter 502.8 Fundamental Science Practices: Review and Approval of Scientific Data for Release. Recharge in the Death Valley regional ground-water flow system (DVRFS) was estimated from net infiltration simulated by Hevesi and others (2003) using a deterministic mass-balance method. Hevesi and others (2003) estimated potential recharge for the DVRFS, an approximately 100,000 square- kilometer region of southern Nevada and California, using the net-infiltration model, INFILv3. Net infiltration, estimated on a cell-by-cell basis,...

These data were released prior to the October 1, 2016 effective date for the USGS’s policy dictating the review, approval, and release of scientific data as referenced in USGS Survey Manual Chapter 502.8 Fundamental Science Practices: Review and Approval of Scientific Data for Release. Recharge in the Death Valley regional ground-water flow system (DVRFS) was estimated from net infiltration simulated by Hevesi and others (2003) using a deterministic mass-balance method. Hevesi and others (2003) estimated potential recharge for the DVRFS, an approximately 100,000 square-kilometer region of southern Nevada and California, using the net-infiltration model, INFILv3. Net infiltration, estimated on a cell-by-cell basis,...
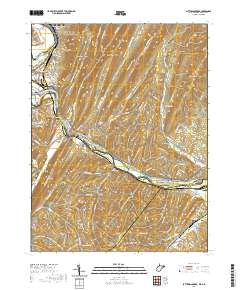
Layered geospatial PDF 7.5 Minute Quadrangle Map. Layers of geospatial data include orthoimagery, roads, grids, geographic names, elevation contours, hydrography, and other selected map features. This map is derived from GIS (geospatial information system) data. It represents a repackaging of GIS data in traditional map form, not creation of new information. The geospatial data in this map are from selected National Map data holdings and other government sources.
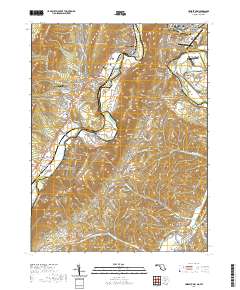
Layered geospatial PDF 7.5 Minute Quadrangle Map. Layers of geospatial data include orthoimagery, roads, grids, geographic names, elevation contours, hydrography, and other selected map features. This map is derived from GIS (geospatial information system) data. It represents a repackaging of GIS data in traditional map form, not creation of new information. The geospatial data in this map are from selected National Map data holdings and other government sources.
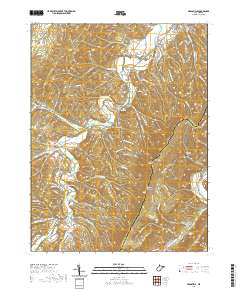
Layered geospatial PDF 7.5 Minute Quadrangle Map. Layers of geospatial data include orthoimagery, roads, grids, geographic names, elevation contours, hydrography, and other selected map features. This map is derived from GIS (geospatial information system) data. It represents a repackaging of GIS data in traditional map form, not creation of new information. The geospatial data in this map are from selected National Map data holdings and other government sources.
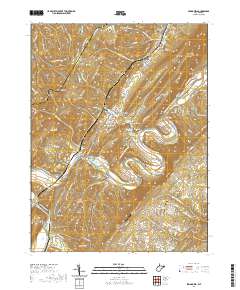
Layered geospatial PDF 7.5 Minute Quadrangle Map. Layers of geospatial data include orthoimagery, roads, grids, geographic names, elevation contours, hydrography, and other selected map features. This map is derived from GIS (geospatial information system) data. It represents a repackaging of GIS data in traditional map form, not creation of new information. The geospatial data in this map are from selected National Map data holdings and other government sources.
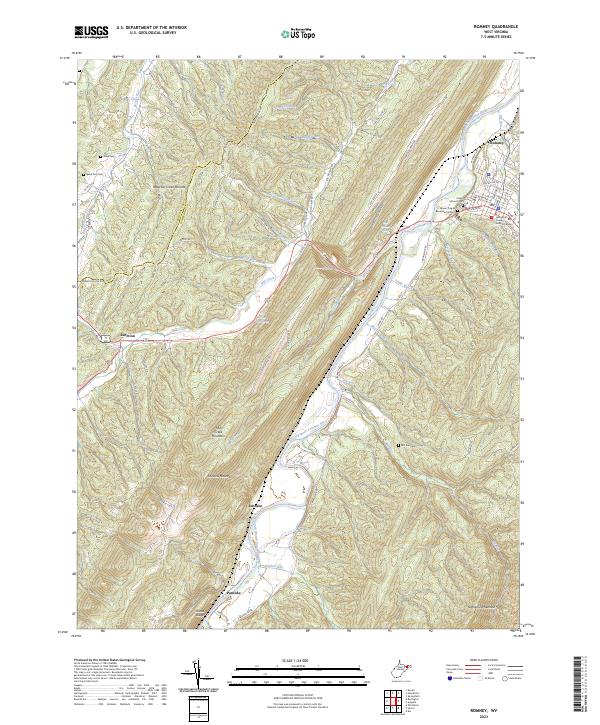
Layered geospatial PDF 7.5 Minute Quadrangle Map. Layers of geospatial data include orthoimagery, roads, grids, geographic names, elevation contours, hydrography, and other selected map features. This map is derived from GIS (geospatial information system) data. It represents a repackaging of GIS data in traditional map form, not creation of new information. The geospatial data in this map are from selected National Map data holdings and other government sources.
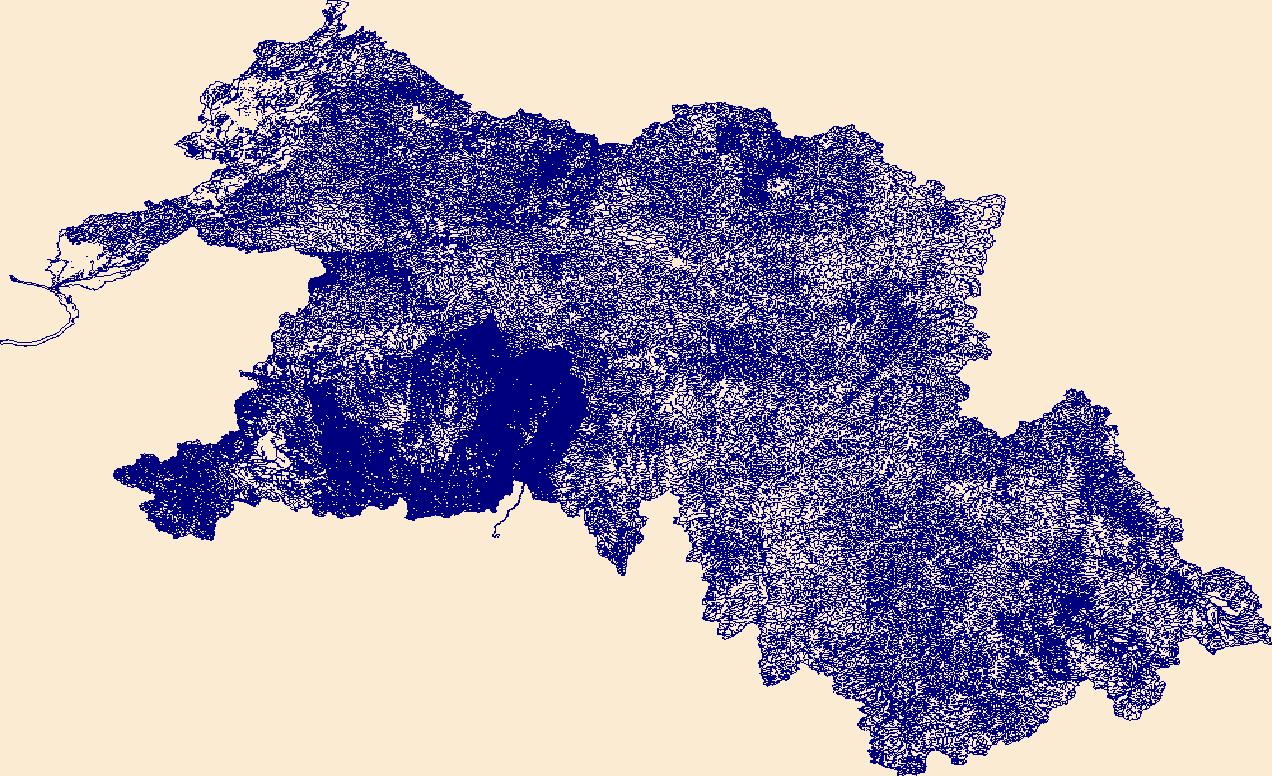
The High Resolution National Hydrography Dataset Plus (NHDPlus HR) is an integrated set of geospatial data layers, including the best available National Hydrography Dataset (NHD), the 10-meter 3D Elevation Program Digital Elevation Model (3DEP DEM), and the National Watershed Boundary Dataset (WBD). The NHDPlus HR combines the NHD, 3DEP DEMs, and WBD to create a stream network with linear referencing, feature naming, "value added attributes" (VAAs), elevation-derived catchments, and other features for hydrologic data analysis. The stream network with linear referencing is a system of data relationships applied to hydrographic systems so that one stream reach "flows" into another and "events" can be tied to and traced...

The High Resolution National Hydrography Dataset Plus (NHDPlus HR) is an integrated set of geospatial data layers, including the National Hydrography Dataset (NHD), National Watershed Boundary Dataset (WBD), and 3D Elevation Program Digital Elevation Model (3DEP DEM). The NHDPlus HR combines the NHD, 3DEP DEMs, and WBD to a data suite that includes the NHD stream network with linear referencing functionality, the WBD hydrologic units, elevation-derived catchment areas for each stream segment, "value added attributes" (VAAs), and other features that enhance hydrologic data analysis and routing.
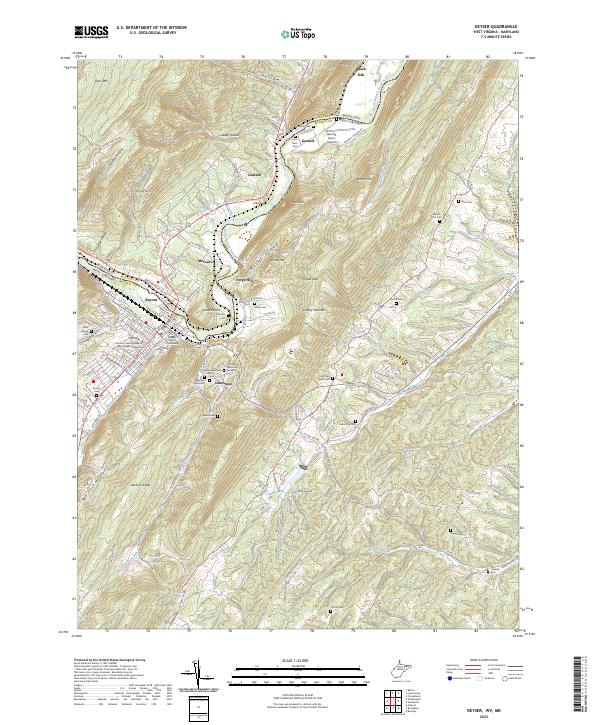
Layered geospatial PDF 7.5 Minute Quadrangle Map. Layers of geospatial data include orthoimagery, roads, grids, geographic names, elevation contours, hydrography, and other selected map features. This map is derived from GIS (geospatial information system) data. It represents a repackaging of GIS data in traditional map form, not creation of new information. The geospatial data in this map are from selected National Map data holdings and other government sources.

These data were released prior to the October 1, 2016 effective date for the USGS’s policy dictating the review, approval, and release of scientific data as referenced in USGS Survey Manual Chapter 502.8 Fundamental Science Practices: Review and Approval of Scientific Data for Release. This digital geospatial data set contains the locations, values, and uncertainties of 700 hydraulic-head observations used in the steady-state, prepumped period of the transient model of the Death Valley regional ground-water flow system (DVRFS), a 100,000-square-kilometer region of southern Nevada and California. Hydraulic-head observations, which are the composite of one or more water-level measurements made at a well, are used...

These data were released prior to the October 1, 2016 effective date for the USGS’s policy dictating the review, approval, and release of scientific data as referenced in USGS Survey Manual Chapter 502.8 Fundamental Science Practices: Review and Approval of Scientific Data for Release. This digital data set defines the lateral boundary and model domain of the area simulated by the transient ground-water flow model of the Death Valley regional ground-water flow system (DVRFS). The DVRFS transient ground-water flow model is the most recent in a number of regional-scale models developed by the U.S. Geological Survey (USGS) for the U.S. Department of Energy (DOE) to support investigations at the Nevada Test Site (NTS)...

These data were released prior to the October 1, 2016 effective date for the USGS’s policy dictating the review, approval, and release of scientific data as referenced in USGS Survey Manual Chapter 502.8 Fundamental Science Practices: Review and Approval of Scientific Data for Release. This digital geospatial data set is a compilation of reference points representing springs in California that were used for the regional ground-water potential map by Bedinger and Harrill (2004). The regional ground-water potential map was developed to assess potential interbasin flow in the Death Valley regional ground-water flow system (DVRFS), a 100,000-square-kilometer region of southern Nevada and California. To obtain an adequate...

These data were released prior to the October 1, 2016 effective date for the USGS’s policy dictating the review, approval, and release of scientific data as referenced in USGS Survey Manual Chapter 502.8 Fundamental Science Practices: Review and Approval of Scientific Data for Release. This digital data set represents discharge areas in the Death Valley regional ground-water flow system (DVRFS) transient model. Natural ground-water discharge occurs by way of evapotranspiration (ET) and spring flow in the DVRFS model domain, an approximately 45,000 square-kilometer region of southern Nevada and California. Ground water is simulated as discharging from a drain boundary (cell) when the simulated head in the cell rises...

These data were released prior to the October 1, 2016 effective date for the USGS’s policy dictating the review, approval, and release of scientific data as referenced in USGS Survey Manual Chapter 502.8 Fundamental Science Practices: Review and Approval of Scientific Data for Release. These contours represent the simulated potentiometric surface at the end of simulation (1998) in model layer 16 of the Death Valley regional ground-water flow system (DVRFS), an approximately 45,000 square-kilometer region of southern Nevada and California. The numerical ground-water flow model simulates prepumping conditions before 1913 and transient-flow conditions from 1913 to 1998 after pumping of ground water began. The DVRFS...

These data were released prior to the October 1, 2016 effective date for the USGS’s policy dictating the review, approval, and release of scientific data as referenced in USGS Survey Manual Chapter 502.8 Fundamental Science Practices: Review and Approval of Scientific Data for Release. This digital data set represents discharge areas in the Death Valley regional ground-water flow system (DVRFS) transient model. Natural ground-water discharge occurs by way of evapotranspiration (ET) and spring flow in the DVRFS model domain, an approximately 45,000 square-kilometer region of southern Nevada and California. Ground water is simulated as discharging from a drain boundary (cell) when the simulated head in the cell rises...

These data were released prior to the October 1, 2016 effective date for the USGS’s policy dictating the review, approval, and release of scientific data as referenced in USGS Survey Manual Chapter 502.8 Fundamental Science Practices: Review and Approval of Scientific Data for Release. The false-color composite image of the Death Valley regional ground-water flow system (DVRFS), an approximately 100,000 square-kilometer region of southern Nevada and California, was derived from Landsat 5 Thematic Mapper (TM) data for 1996. The image is a composite of spectral bands 2, 4, and 7 in RGB (Red-Green-Blue) space. Individual bands were processed to display their full dynamic range. The image was further processed in hue-saturation...

These data were released prior to the October 1, 2016 effective date for the USGS’s policy dictating the review, approval, and release of scientific data as referenced in USGS Survey Manual Chapter 502.8 Fundamental Science Practices: Review and Approval of Scientific Data for Release. This digital data set represents the Death Valley regional ground-water flow system (DVRFS) study area which encompasses approximately 100,000-square kilometers in Nevada and California and is bounded by latitudes 35-degrees north and 38-degrees 15-minutes north and by longitudes 115-degrees west and 118-degrees west. The study area boundary encompasses the DVRFS model domain which is the area simulated by a transient ground-water...
|

|
