Filters: Tags: Minnesota (X)
13,624 results (70ms)|
Filters
Date Range
Extensions Types
Contacts
Categories Tag Types
|
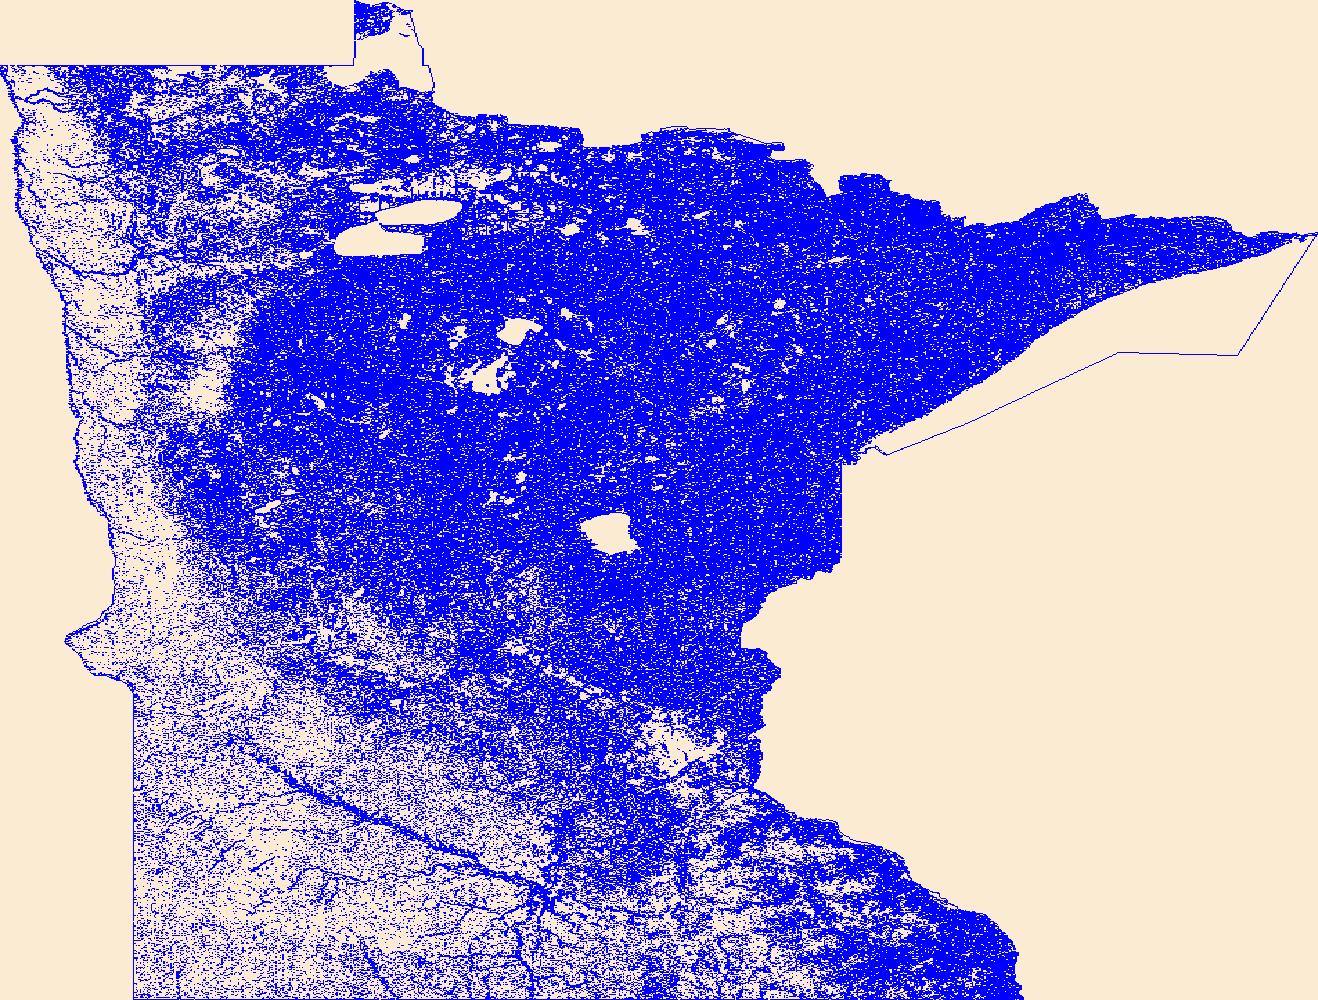
Observed water temperatures from 1980-2019 were compiled for 2,332 lakes in the US. These data were used as training, test, and error-estimation data for process-guided deep learning models and the evaluation of process-based models. The data are formatted as a single csv (comma separated values) file with attributes corresponding to the unique combination of lake identifier, time, and depth. Data came from a variety of sources, including the Water Quality Portal, the North Temperate Lakes Long-Term Ecological Research Project, and digitized temperature records from the MN Department of Natural Resources. This dataset is part of a larger data release of lake temperature model inputs and outputs for these same lakes...
This dataset provides aqueous nitrate+nitrite, aqueous manganese, aqueous iron, and total sulfate measurements in groundwater samples from 254 newly constructed private residential wells between 2014 and 2016. The study focuses on three geologically distinct regions of Minnesota: central, northwest, and northeast. These study regions were chosen due to their prevalent elevated As concentrations in drinking water. Each of the 254 wells were sampled in three rounds by the Minnesota Department of Health (MDH). The timing of the three sampling rounds was (1) immediately or shortly after well construction (round 1); (2) 3-6 months after initial sample collection (round 2); and (3) 12 months after initial sample collection...
Categories: Data;
Tags: Anoka County,
Becker County,
Beltrami County,
Carlton County,
Carver County,
Geospatial data that is a derivative land cover product depicting woodland on topographic maps.
These data represent simulated soil temperature and moisture conditions for current climate, and for future climate represented by all available climate models at two time periods during the 21st century. These data were used to: 1) quantify the direction and magnitude of expected changes in several measures of soil temperature and soil moisture, including the key variables used to distinguish the regimes used in the R and R categories; 2) assess how these changes will impact the geographic distribution of soil temperature and moisture regimes; and 3) explore the implications for using R and R categories for estimating future ecosystem resilience and resistance.
Using predicted lake temperatures from uncalibrated, process-based models (PB0) and process-guided deep learning models (PGDL), this dataset summarized a collection of thermal metrics to characterize lake temperature impacts on fish habitat for 881 lakes. Included in the metrics are daily thermal optical habitat areas and a set of over 172 annual thermal metrics.
This dataset consists of 176 wideband magnetotelluric (MT) stations collected from 2015-2019 across parts of Minnesota, Wisconsin and the Upper Peninsula of Michigan. The U.S. Geological Survey (USGS) acquired these data as part of regional investigations into the geologic and tectonic framework of the area and to support mineral resource investigations. These data have been used to generate a 3D regional conductivity model of the area. Files included in this publication include measured electric- and magnetic-field time series as well as estimated impedance and vertical-magnetic field transfer functions. The data included here are for MT station pen107 in the Penokean Orogeny survey region. A shapefile with station...
This dataset consists of 176 wideband magnetotelluric (MT) stations collected from 2015-2019 across parts of Minnesota, Wisconsin and the Upper Peninsula of Michigan. The U.S. Geological Survey (USGS) acquired these data as part of regional investigations into the geologic and tectonic framework of the area and to support mineral resource investigations. These data have been used to generate a 3D regional conductivity model of the area. Files included in this publication include measured electric- and magnetic-field time series as well as estimated impedance and vertical-magnetic field transfer functions. The data included here are for MT station pen116 in the Penokean Orogeny survey region. A shapefile with station...
This dataset consists of 176 wideband magnetotelluric (MT) stations collected from 2015-2019 across parts of Minnesota, Wisconsin and the Upper Peninsula of Michigan. The U.S. Geological Survey (USGS) acquired these data as part of regional investigations into the geologic and tectonic framework of the area and to support mineral resource investigations. These data have been used to generate a 3D regional conductivity model of the area. Files included in this publication include measured electric- and magnetic-field time series as well as estimated impedance and vertical-magnetic field transfer functions. The data included here are for MT station pen120 in the Penokean Orogeny survey region. A shapefile with station...
This dataset consists of 176 wideband magnetotelluric (MT) stations collected from 2015-2019 across parts of Minnesota, Wisconsin and the Upper Peninsula of Michigan. The U.S. Geological Survey (USGS) acquired these data as part of regional investigations into the geologic and tectonic framework of the area and to support mineral resource investigations. These data have been used to generate a 3D regional conductivity model of the area. Files included in this publication include measured electric- and magnetic-field time series as well as estimated impedance and vertical-magnetic field transfer functions. The data included here are for MT station pen117 in the Penokean Orogeny survey region. A shapefile with station...
This dataset consists of 176 wideband magnetotelluric (MT) stations collected from 2015-2019 across parts of Minnesota, Wisconsin and the Upper Peninsula of Michigan. The U.S. Geological Survey (USGS) acquired these data as part of regional investigations into the geologic and tectonic framework of the area and to support mineral resource investigations. These data have been used to generate a 3D regional conductivity model of the area. Files included in this publication include measured electric- and magnetic-field time series as well as estimated impedance and vertical-magnetic field transfer functions. The data included here are for MT station pen010 in the Penokean Orogeny survey region. A shapefile with station...
This dataset consists of 176 wideband magnetotelluric (MT) stations collected from 2015-2019 across parts of Minnesota, Wisconsin and the Upper Peninsula of Michigan. The U.S. Geological Survey (USGS) acquired these data as part of regional investigations into the geologic and tectonic framework of the area and to support mineral resource investigations. These data have been used to generate a 3D regional conductivity model of the area. Files included in this publication include measured electric- and magnetic-field time series as well as estimated impedance and vertical-magnetic field transfer functions. The data included here are for MT station pen007 in the Penokean Orogeny survey region. A shapefile with station...
This dataset consists of 176 wideband magnetotelluric (MT) stations collected from 2015-2019 across parts of Minnesota, Wisconsin and the Upper Peninsula of Michigan. The U.S. Geological Survey (USGS) acquired these data as part of regional investigations into the geologic and tectonic framework of the area and to support mineral resource investigations. These data have been used to generate a 3D regional conductivity model of the area. Files included in this publication include measured electric- and magnetic-field time series as well as estimated impedance and vertical-magnetic field transfer functions. The data included here are for MT station wup413 in the Western Upper Peninsula survey region. A shapefile with...
This dataset consists of 176 wideband magnetotelluric (MT) stations collected from 2015-2019 across parts of Minnesota, Wisconsin and the Upper Peninsula of Michigan. The U.S. Geological Survey (USGS) acquired these data as part of regional investigations into the geologic and tectonic framework of the area and to support mineral resource investigations. These data have been used to generate a 3D regional conductivity model of the area. Files included in this publication include measured electric- and magnetic-field time series as well as estimated impedance and vertical-magnetic field transfer functions. The data included here are for MT station wup403 in the Western Upper Peninsula survey region. A shapefile with...
This dataset consists of 176 wideband magnetotelluric (MT) stations collected from 2015-2019 across parts of Minnesota, Wisconsin and the Upper Peninsula of Michigan. The U.S. Geological Survey (USGS) acquired these data as part of regional investigations into the geologic and tectonic framework of the area and to support mineral resource investigations. These data have been used to generate a 3D regional conductivity model of the area. Files included in this publication include measured electric- and magnetic-field time series as well as estimated impedance and vertical-magnetic field transfer functions. The data included here are for MT station wup508 in the Western Upper Peninsula survey region. A shapefile with...

This map layer shows Indian lands of the United States. For the most part, only areas of 320 acres or more are included; some smaller areas deemed to be important or significant are also included. Federally-administered lands within a reservation are included for continuity; these may or may not be considered part of the reservation and are simply described with their feature type and the administrating Federal agency. Some established Indian lands which are larger than 320 acres are not included in this map layer because their boundaries were not available from the owning or administering agency.
This dataset provides shapefile outlines of the 7,150 lakes that had temperature modeled as part of this study. The format is a shapefile for all lakes combined (.shp, .shx, .dbf, and .prj files). A csv file of lake metadata is also included. This dataset is part of a larger data release of lake temperature model inputs and outputs for 7,150 lakes in the U.S. states of Minnesota and Wisconsin (http://dx.doi.org/10.5066/P9CA6XP8).
Categories: Data;
Types: Downloadable,
Map Service,
OGC WFS Layer,
OGC WMS Layer,
Shapefile;
Tags: IA,
IL,
IN,
Illinois,
Indiana,
The Critical Minerals in Archived Mine Samples Database (CMDB) contains chemistry and geologic information for historic ore and ore-related rock samples from mineral deposits in the United States. In addition, the database contains samples from archetypal deposits from 27 other countries in North America, South America, Asia, Africa and Europe. Samples were obtained from archived ore collections under the U.S. Geological Survey's project titled "Quick Assessment of Rare and Critical Metals in Ore Deposits: A National Assessment" (2008 to 2013) in an effort to begin an assessment of the Nations' previously mined ore deposits for critical minerals. Mineralized and altered rock samples were provided by the Colorado...
Categories: Data;
Types: ArcGIS REST Map Service,
ArcGIS Service Definition,
Downloadable,
Map Service,
OGC WFS Layer,
OGC WMS Layer,
Shapefile;
Tags: Alaska,
Argentina,
Arizona,
Arkansas,
Australia,
Geographic distribution data were collected based on county level occurrences (or converted from point occurrences to county level occurrences) within the five focal states (Minnesota, North Dakota, South Dakota, Nebraska & Iowa) and each U.S. state or Canadian province bordering those focal states (Wisconsin, Illinois, Missouri, Kansas, Wyoming, & Montana in the USA and Saskatchewan, Ontario & Manitoba in Canada).
The U.S. Geological Survey (USGS) has developed and implemented an algorithm that identifies burned areas in dense time series of Landsat image stacks to produce the Landsat Burned Area Essential Climate Variable (BAECV) products. The algorithm makes use of predictors derived from individual Landsat scenes, lagged reference conditions, and change metrics between the scene and reference conditions. Outputs of the BAECV algorithm consist of pixel-level burn probabilities for each Landsat scene, and annual burn probability, burn classification, and burn date composites. These products were generated for the conterminous United States for 1984 through 2015. These data are also available for download at https://rmgsc.cr.usgs.gov/outgoing/baecv/BAECV_CONUS_v1.1_2017/...
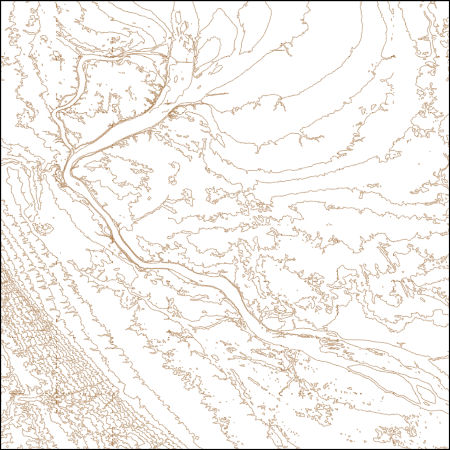
These vector contour lines are derived from the 3D Elevation Program using automated and semi-automated processes. They were created to support 1:24,000-scale CONUS and Hawaii, 1:25,000-scale Alaska, and 1:20,000-scale Puerto Rico / US Virgin Island topographic map products, but are also published in this GIS vector format. Contour intervals are assigned by 7.5-minute quadrangle, so this vector dataset is not visually seamless across quadrangle boundaries. The vector lines have elevation attributes (in feet above mean sea level on NAVD88), but this dataset does not carry line symbols or annotation.
|

|
