Filters: Tags: Mono County (X)
437 results (63ms)|
Filters
Date Range
Extensions Types Contacts
Categories Tag Types
|
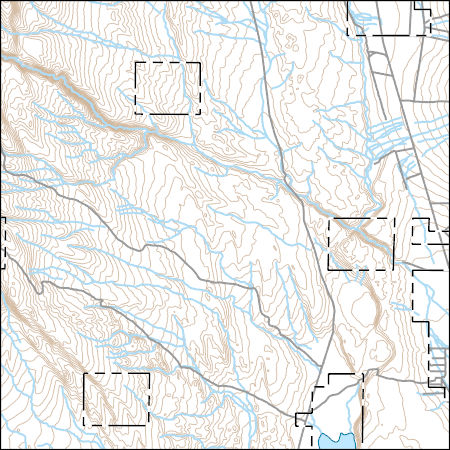
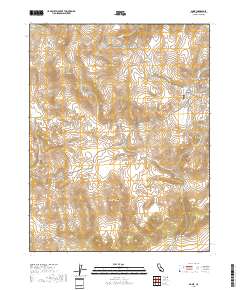
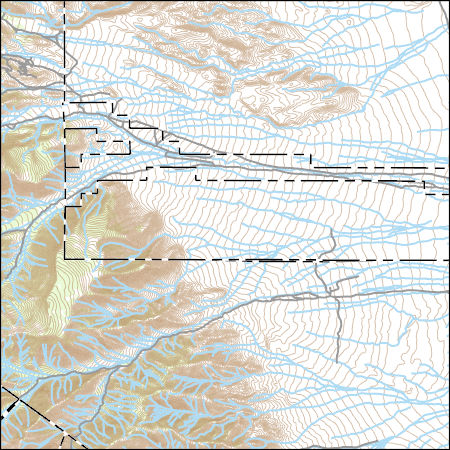
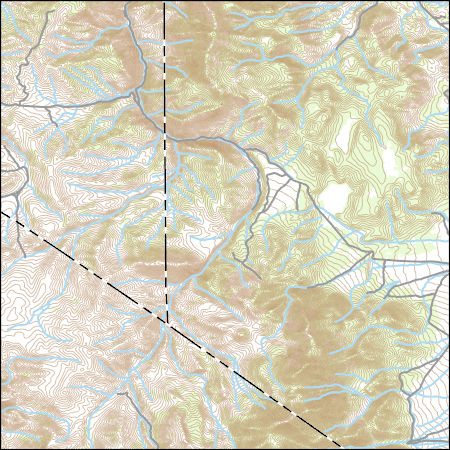
Layers of geospatial data include contours, boundaries, land cover, hydrography, roads, transportation, geographic names, structures, and other selected map features.
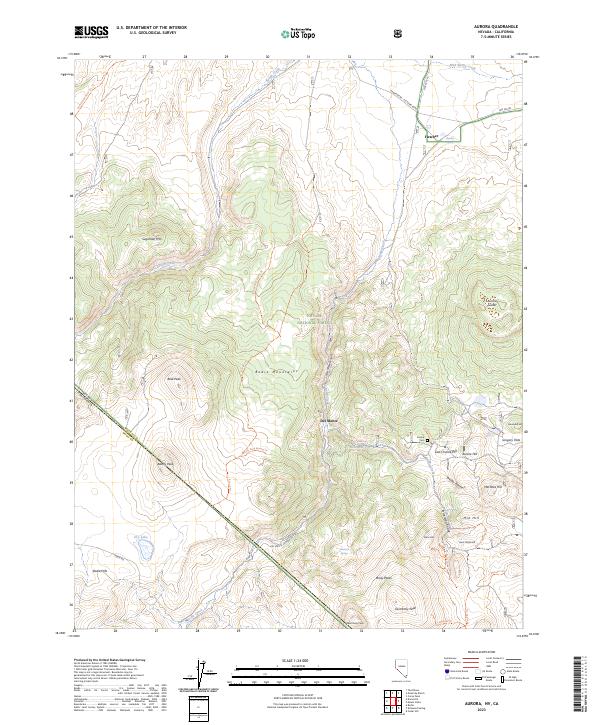
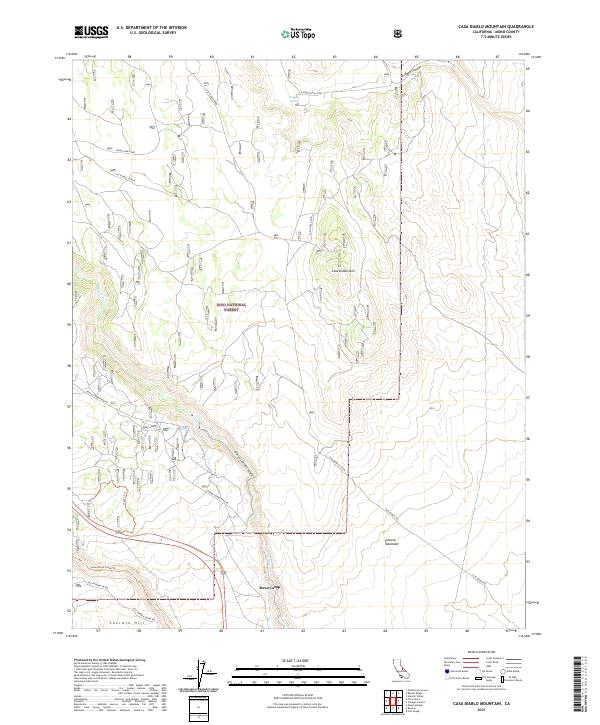
Layered geospatial PDF 7.5 Minute Quadrangle Map. Layers of geospatial data include orthoimagery, roads, grids, geographic names, elevation contours, hydrography, and other selected map features. This map is derived from GIS (geospatial information system) data. It represents a repackaging of GIS data in traditional map form, not creation of new information. The geospatial data in this map are from selected National Map data holdings and other government sources.

These data were released prior to the October 1, 2016 effective date for the USGS’s policy dictating the review, approval, and release of scientific data as referenced in USGS Survey Manual Chapter 502.8 Fundamental Science Practices: Review and Approval of Scientific Data for Release. This digital data set defines the boundary of the ground-water flow model by D'Agnese and others (1997). This steady-state, 3-layer ground-water flow model was developed by the U.S. Geological Survey (USGS) for the U.S. Department of Energy (DOE) to support investigations at Yucca Mountain, Nevada (see "Larger Work Citation", Chapter A, pages 7-8, for details). The model area encompasses approximately 35,000 square-kilometers of...

These data were released prior to the October 1, 2016 effective date for the USGS’s policy dictating the review, approval, and release of scientific data as referenced in USGS Survey Manual Chapter 502.8 Fundamental Science Practices: Review and Approval of Scientific Data for Release. This digital data set defines the lateral boundary and model domain of the area simulated by the transient ground-water flow model of the Death Valley regional ground-water flow system (DVRFS). The DVRFS transient ground-water flow model is the most recent in a number of regional-scale models developed by the U.S. Geological Survey (USGS) for the U.S. Department of Energy (DOE) to support investigations at the Nevada Test Site (NTS)...

These data were released prior to the October 1, 2016 effective date for the USGS’s policy dictating the review, approval, and release of scientific data as referenced in USGS Survey Manual Chapter 502.8 Fundamental Science Practices: Review and Approval of Scientific Data for Release. This digital data set defines the hydraulic-head values in 16 model layers used to initiate the transient simulation of the Death Valley regional ground-water flow system (DVRFS) model. The area simulated by the DVRFS transient ground-water flow model is an approximately 45,000 square-kilometer region of southern Nevada and California. In order to reduce model execution time, hydraulic head values output from the steady-state simulation...

These data were released prior to the October 1, 2016 effective date for the USGS’s policy dictating the review, approval, and release of scientific data as referenced in USGS Survey Manual Chapter 502.8 Fundamental Science Practices: Review and Approval of Scientific Data for Release. This digital data set is a compilation of reference points representing surface-water features, ground-water levels, and topographic settings in Nevada that were used for the regional ground-water potential map by Bedinger and Harrill (2004). The regional ground-water-potential map was developed to assess potential interbasin flow in the Death Valley regional ground-water flow system (DVRFS), a 100,000-square-kilometer region of...

These data were released prior to the October 1, 2016 effective date for the USGS’s policy dictating the review, approval, and release of scientific data as referenced in USGS Survey Manual Chapter 502.8 Fundamental Science Practices: Review and Approval of Scientific Data for Release. This digital geospatial data set is a compilation of reference points representing wells deeper than 300 meters in Nevada that were used for the regional ground-water potential map by Bedinger and Harrill (2004). The regional ground-water-potential map was developed to assess potential interbasin flow in the Death Valley regional ground-water flow system (DVRFS), a 100,000 square-kilometer region of southern Nevada and California....

These data were released prior to the October 1, 2016 effective date for the USGS’s policy dictating the review, approval, and release of scientific data as referenced in USGS Survey Manual Chapter 502.8 Fundamental Science Practices: Review and Approval of Scientific Data for Release. This digital data set defines the boundary of the hydrogeologic framework model (HFM) developed by IT Corporation (1996) for the U.S. Department of Energy Underground Test Area Phase I project. The boundary encompasses an approximate 53,000 square-kilometer region which is centered on the Nevada Test Site (NTS) and extends from Death Valley to east of the East Pahranagat Range, and from the Black Mountains to north of Penoyer and...
Fumarole gas geochemistry and tree-ring radiocarbon data at Mammoth Mountain, California (1989-2016)
Mammoth Mountain is a dacitic dome complex located on the southwestern rim of Long Valley Caldera, California. Mammoth Mountain has exhibited unrest over the past ~30 years, characterized by seismicity over a broad range of depths, elevated 3He/4He ratios in fumarolic gas and large-scale diffuse CO2 emissions. Monitoring of this unrest has included collection of fumarole gas samples for geochemical analysis and tree cores for radiocarbon analysis of annual growth rings. This report updates the long-term geochemical record at Mammoth Mountain, compiling the chemical and isotopic (d13C-CO2, 3He/4He) compositions of 59 gas samples collected from Mammoth Mountain fumarole from 1998 to 2016. In addition, we report radiocarbon...
Categories: Data;
Tags: Geochemistry,
Mammoth Lakes,
Mammoth Mountain,
Mono County,
USGS Science Data Catalog (SDC),
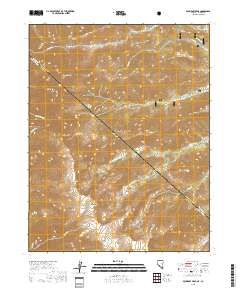
Layered geospatial PDF 7.5 Minute Quadrangle Map. Layers of geospatial data include orthoimagery, roads, grids, geographic names, elevation contours, hydrography, and other selected map features. This map is derived from GIS (geospatial information system) data. It represents a repackaging of GIS data in traditional map form, not creation of new information. The geospatial data in this map are from selected National Map data holdings and other government sources.
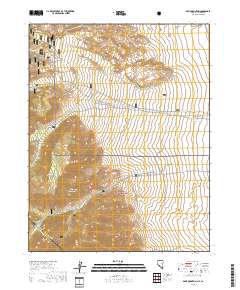
Layered geospatial PDF 7.5 Minute Quadrangle Map. Layers of geospatial data include orthoimagery, roads, grids, geographic names, elevation contours, hydrography, and other selected map features. This map is derived from GIS (geospatial information system) data. It represents a repackaging of GIS data in traditional map form, not creation of new information. The geospatial data in this map are from selected National Map data holdings and other government sources.
Layered geospatial PDF 7.5 Minute Quadrangle Map. Layers of geospatial data include orthoimagery, roads, grids, geographic names, elevation contours, hydrography, and other selected map features. This map is derived from GIS (geospatial information system) data. It represents a repackaging of GIS data in traditional map form, not creation of new information. The geospatial data in this map are from selected National Map data holdings and other government sources.
Layers of geospatial data include contours, boundaries, land cover, hydrography, roads, transportation, geographic names, structures, and other selected map features.
Layers of geospatial data include contours, boundaries, land cover, hydrography, roads, transportation, geographic names, structures, and other selected map features.
Layered geospatial PDF 7.5 Minute Quadrangle Map. Layers of geospatial data include orthoimagery, roads, grids, geographic names, elevation contours, hydrography, and other selected map features. This map is derived from GIS (geospatial information system) data. It represents a repackaging of GIS data in traditional map form, not creation of new information. The geospatial data in this map are from selected National Map data holdings and other government sources.
Layered geospatial PDF 7.5 Minute Quadrangle Map. Layers of geospatial data include orthoimagery, roads, grids, geographic names, elevation contours, hydrography, and other selected map features. This map is derived from GIS (geospatial information system) data. It represents a repackaging of GIS data in traditional map form, not creation of new information. The geospatial data in this map are from selected National Map data holdings and other government sources.
Layers of geospatial data include contours, boundaries, land cover, hydrography, roads, transportation, geographic names, structures, and other selected map features.
Layers of geospatial data include contours, boundaries, land cover, hydrography, roads, transportation, geographic names, structures, and other selected map features.
Layered geospatial PDF 7.5 Minute Quadrangle Map. Layers of geospatial data include orthoimagery, roads, grids, geographic names, elevation contours, hydrography, and other selected map features. This map is derived from GIS (geospatial information system) data. It represents a repackaging of GIS data in traditional map form, not creation of new information. The geospatial data in this map are from selected National Map data holdings and other government sources.
Layered geospatial PDF 7.5 Minute Quadrangle Map. Layers of geospatial data include orthoimagery, roads, grids, geographic names, elevation contours, hydrography, and other selected map features. This map is derived from GIS (geospatial information system) data. It represents a repackaging of GIS data in traditional map form, not creation of new information. The geospatial data in this map are from selected National Map data holdings and other government sources.
|

|
