Filters: Tags: Monterey County (X)
486 results (168ms)|
Filters
Date Range
Extensions Types Contacts
Categories Tag Types
|
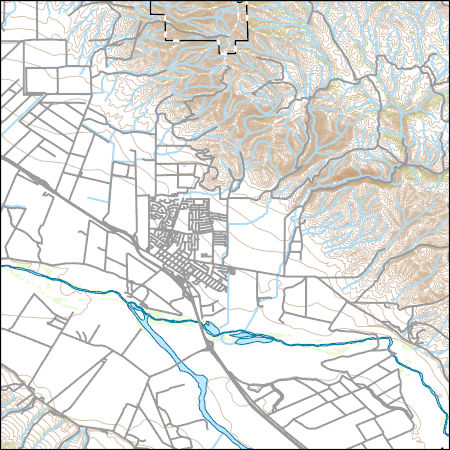
Layers of geospatial data include contours, boundaries, land cover, hydrography, roads, transportation, geographic names, structures, and other selected map features.
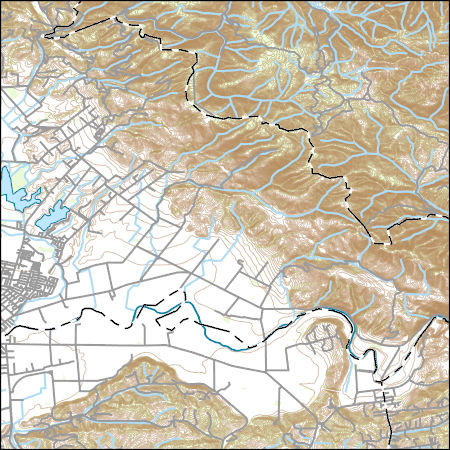
Layers of geospatial data include contours, boundaries, land cover, hydrography, roads, transportation, geographic names, structures, and other selected map features.
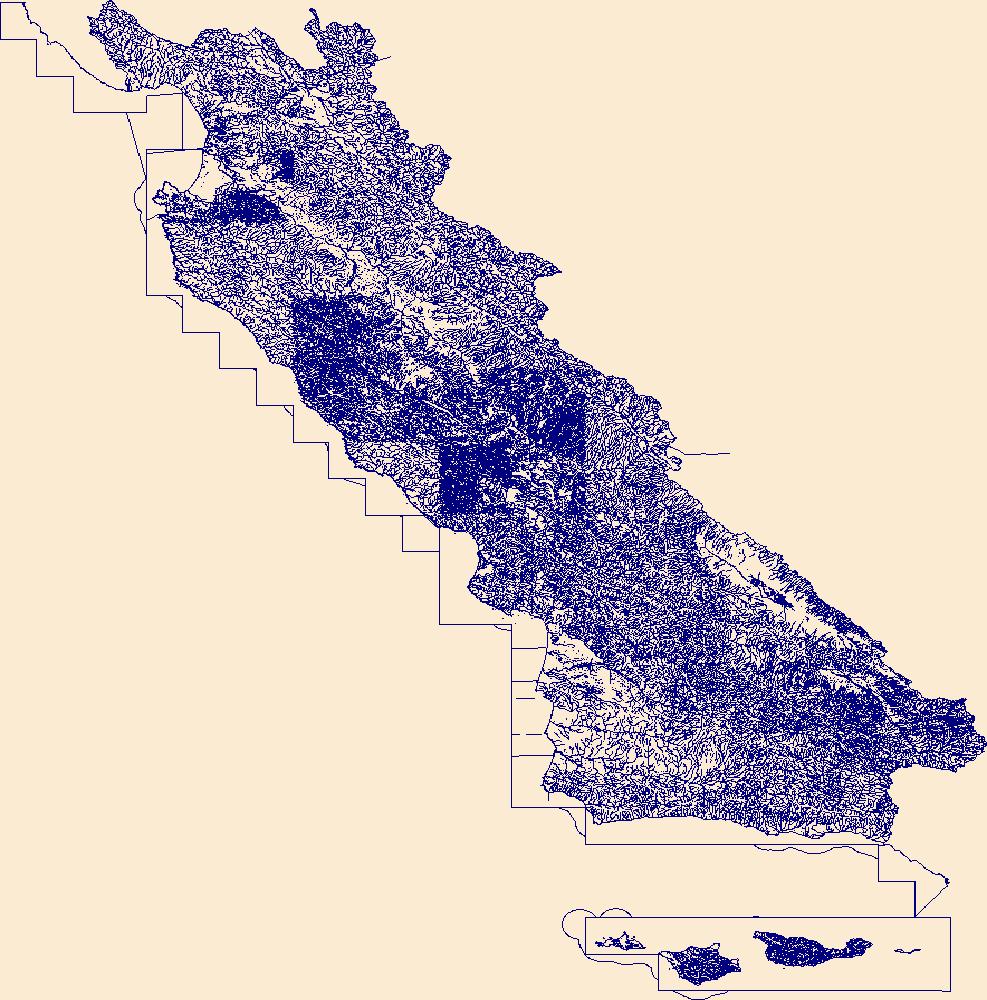
LUCAS-W is a scenario-based simulation model of coupled land use change and associated water demand for California's Central Coast region from 2001-2061. The model is a verison of the LUCAS model, which uses the SyncroSim software framework (Software documentation available at http://doc.syncrosim.com/index.php?title=Reference_Guide), that contains a new coupling with statistical software R (https://www.r-project.org/) to enable dynamic feedbacks between land-use change, resulting water demand, and water availability. The model was parameterized with land-use change and water use empirically estimated from county-scale historic data, as well as results from dozens of local agencies’ groundwater modeling efforts....
Categories: Data;
Types: Map Service,
OGC WFS Layer,
OGC WMS Layer,
OGC WMS Service;
Tags: Central California Coast,
Ecology,
LUCAS Model,
Land Use Change,
Monterey County,
The High Resolution National Hydrography Dataset Plus (NHDPlus HR) is an integrated set of geospatial data layers, including the best available National Hydrography Dataset (NHD), the 10-meter 3D Elevation Program Digital Elevation Model (3DEP DEM), and the National Watershed Boundary Dataset (WBD). The NHDPlus HR combines the NHD, 3DEP DEMs, and WBD to create a stream network with linear referencing, feature naming, "value added attributes" (VAAs), elevation-derived catchments, and other features for hydrologic data analysis. The stream network with linear referencing is a system of data relationships applied to hydrographic systems so that one stream reach "flows" into another and "events" can be tied to and traced...

These data were released prior to the October 1, 2016 effective date for the USGS’s policy dictating the review, approval, and release of scientific data as referenced in USGS Survey Manual Chapter 502.8 Fundamental Science Practices: Review and Approval of Scientific Data for Release. This digital dataset contains the virtual wells used for urban (municipal and industrial use) pumpage for the Central Valley Hydrologic Model (CVHM). The Central Valley encompasses an approximate 50,000 square-kilometer region of California. The complex hydrologic system of the Central Valley is simulated using the U.S. Geological Survey (USGS) numerical modeling code MODFLOW-FMP (Schmid and others, 2006). This application is referred...
This portion of the data release presents a digital surface model (DSM) and digital elevation model (DEM) of the exposed Los Padres Reservoir delta where the Carmel River enters the reservoir. The DSM and DEM have a resolution of 10 centimeters per pixel and were derived from structure-from-motion (SfM) processing of aerial imagery collected with an unoccupied aerial system (UAS) on 2017-11-01. The DSM represents the elevation of the highest object within the bounds of a cell, including vegetation, woody debris and other objects. The DEM represent the elevation of the ground surface where it was visible to the acquisiton system. Due to the nature of SfM processing, the DEM may not represent a true bare-earth surface...
Categories: Data;
Tags: Bathymetry and Elevation,
CHMRP,
Carmel River,
Coastal and Marine Hazards and Resources Program,
Monterey County,
Rainfall measurements were collected in and near the Dolan Fire burn area, Los Padres National Forest, California. The CZU Fire ignited in Los Padres National Forest, California, on August 18, 2020. By the time of full containment on December 31, 2020, the fire had burned 518 km2 (128,050 acres) in Monterey County. The U.S. Geological Survey (USGS) installed seven rain gages in and near the Dolan Fire burn area in October 2021 to measure rainfall during two post-fire wet seasons. This data release contains rain records from the Mill Creek and upper Nacimiento River watersheds collected during water year 2023 (October 1, 2022, through spring 2023). Previous datasets from this region included an additional rain gage...
Categories: Data;
Tags: CMHRP,
Climatology,
Coastal and Marine Hazards and Resources Program,
Monterey County,
PCMSC,
This part of the data release presents topography data from northern Monterey Bay, California collected in September 2015 using a tripod-mounted Riegl VZ-1000 lidar scanner (USGS Field Activity 2015-668-FA). For each area surveyed, the scanner was placed at several positions which were selected to provide maximum line-of-sight coverage of the area of interest. Scans were typically conducted in panoramic mode, creating a detailed point cloud of all unobstructed surfaces in a 360 degree view of the scanner. At each scan position, co-registered photographic imagery was also collected with a scanner mounted DSLR camera. Scanner registration was performed by placing four or more cylindrical or flat reflective tripod-mounted...
Categories: Data;
Types: Map Service,
OGC WFS Layer,
OGC WMS Layer,
OGC WMS Service;
Tags: Bathymetry and Elevation,
CMGP,
Coastal and Marine Geology Program,
GPS (Global Positioning System),
LIDAR,
This data release supersedes version 1, published in 2017 under https://doi.org/10.5066/F74M93HF. Please see Version_History_P9HG8UDS.txt below for more information. Pebble-count data were collected during summer surveys (2013, 2015, 2016, 2017, 2018, 2019, 2020, and 2021) at ten sites along the Carmel River, California. Grain-size measurements were made at four to six transects per site using a 0.5 by 0.5 m sampling frame, with approximately 100 sediment-particle counts per transect. Each transect was defined by coordinates on the left and right sides of the river, and sediment grain sizes were measured at five equally spaced locations within the bankfull channel on the transect defined by those endpoint coordinates...
Categories: Data;
Tags: CMHRP,
Carmel River,
Carmel Valley,
Coastal and Marine Hazards and Resources Program,
Monterey County,
This part of DS 781 presents data for the transgressive contours for the depth-to-transition map of the Pigeon Point to Monterey, California, map region. The vector file is included in T "TransgressiveContours_PigeonPointToMonterey.zip," which is accessible from https://doi.org/10.5066/F7N29V0Z. As part of the USGS's California State Waters Mapping Project, a 50-m grid of sediment thickness for the seafloor within the limit of California’s State Waters between Pigeon Point and southern Monterey Bay was generated from seismic-reflection data collected in 2009 and 2010 (USGS activities (S-15-10-NC, S-N1-09-MB, and S-06-11-MB) supplemented with outcrop and geologic structure from DS 781. The resulting grid covers was...
Categories: Data;
Types: Downloadable,
Map Service,
OGC WFS Layer,
OGC WMS Layer,
Shapefile;
Tags: Ano Nuevo,
Aptos,
Distributions,
Marina,
Monterey,
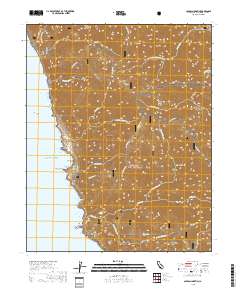
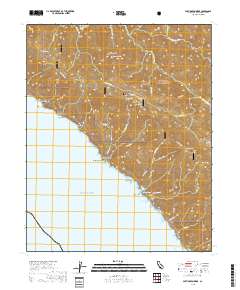
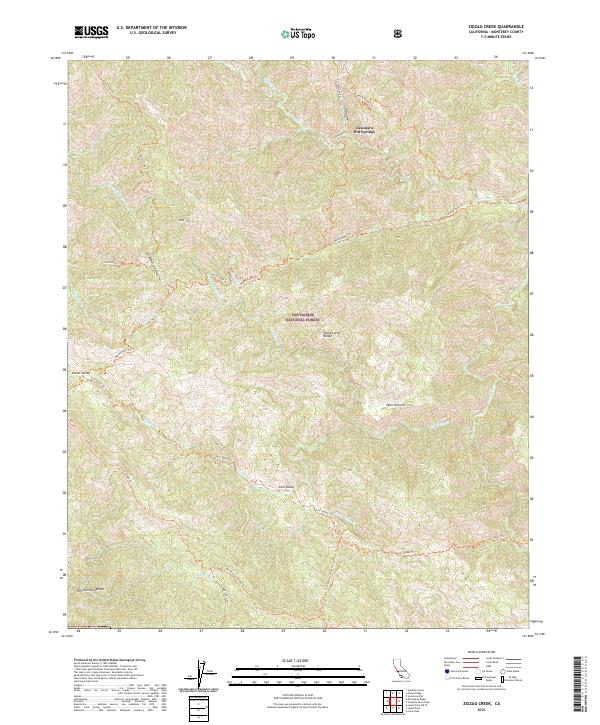
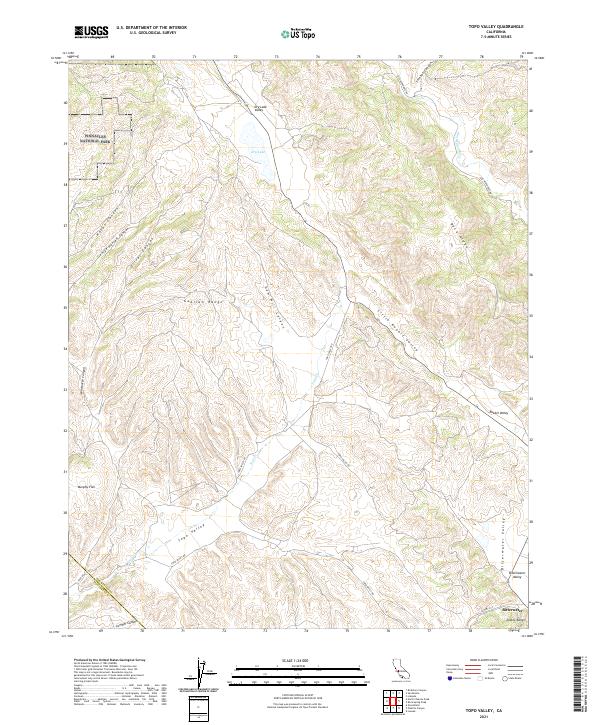
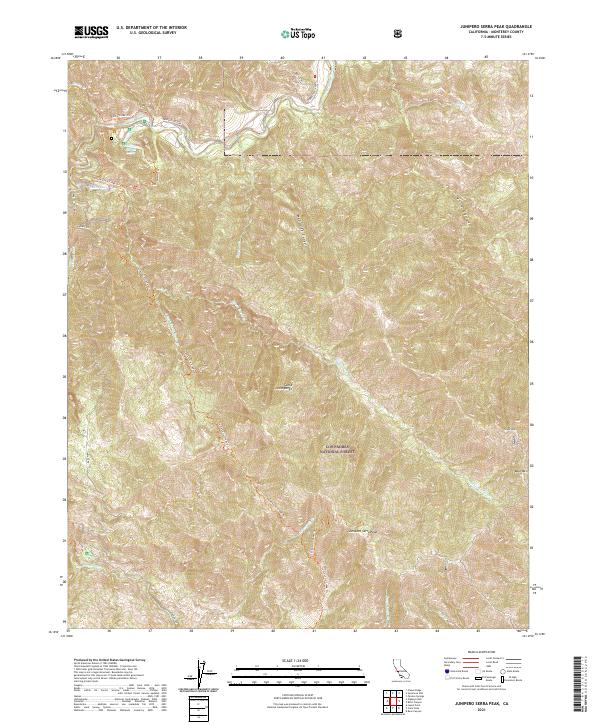
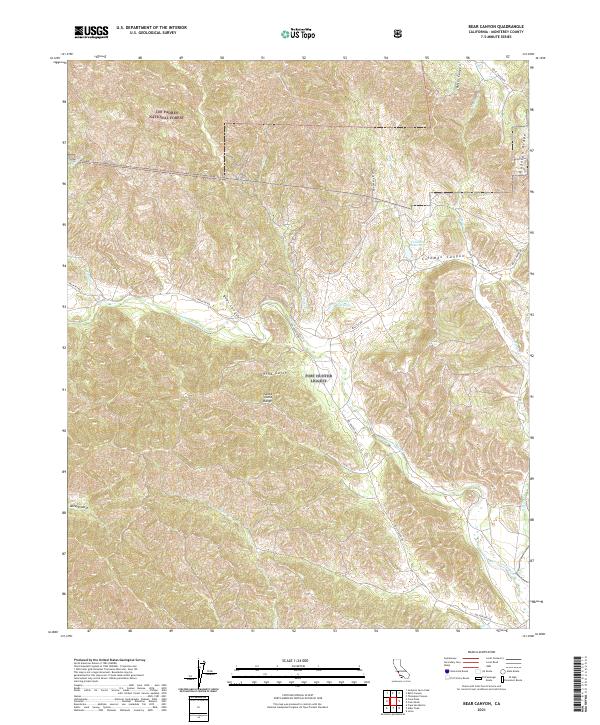
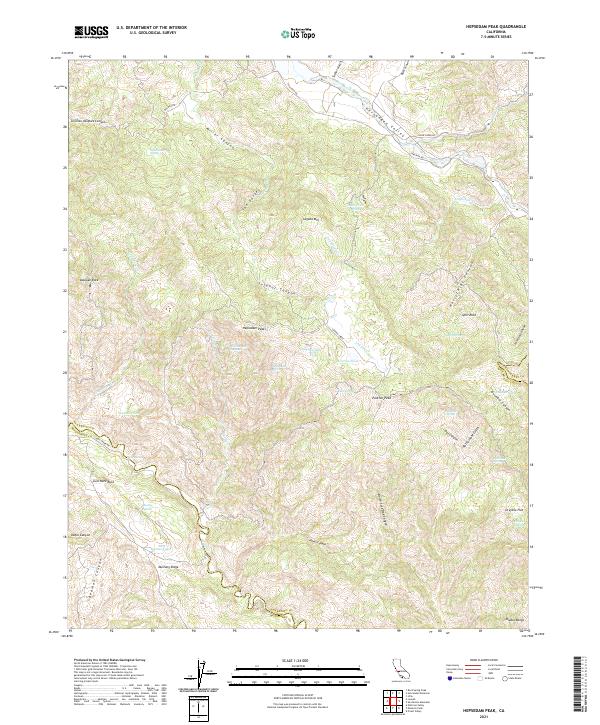
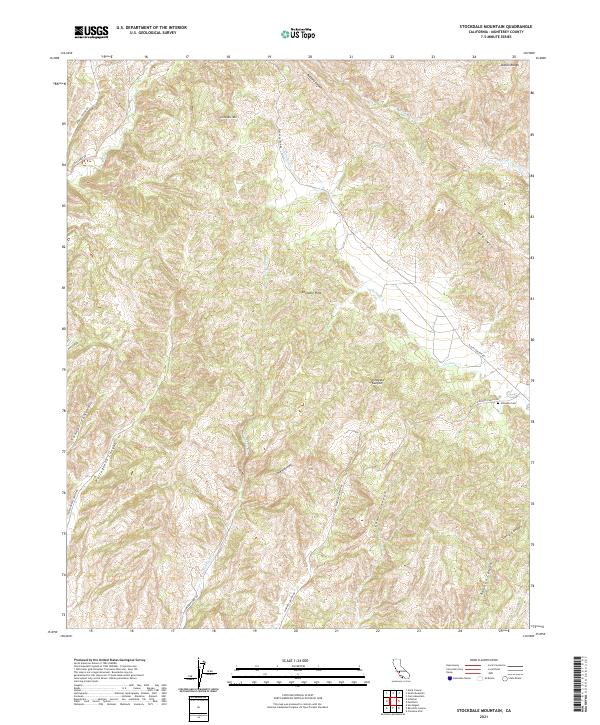
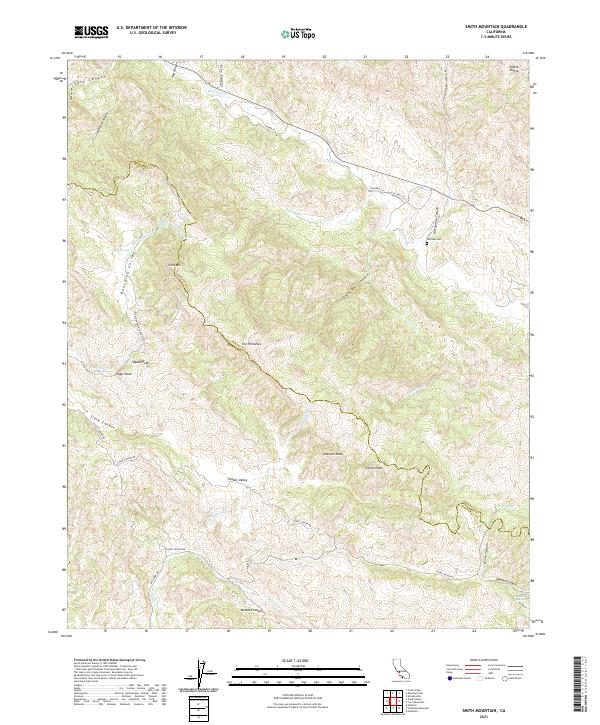
Layered geospatial PDF 7.5 Minute Quadrangle Map. Layers of geospatial data include orthoimagery, roads, grids, geographic names, elevation contours, hydrography, and other selected map features. This map is derived from GIS (geospatial information system) data. It represents a repackaging of GIS data in traditional map form, not creation of new information. The geospatial data in this map are from selected National Map data holdings and other government sources.
Layered geospatial PDF 7.5 Minute Quadrangle Map. Layers of geospatial data include orthoimagery, roads, grids, geographic names, elevation contours, hydrography, and other selected map features. This map is derived from GIS (geospatial information system) data. It represents a repackaging of GIS data in traditional map form, not creation of new information. The geospatial data in this map are from selected National Map data holdings and other government sources.
Layered geospatial PDF 7.5 Minute Quadrangle Map. Layers of geospatial data include orthoimagery, roads, grids, geographic names, elevation contours, hydrography, and other selected map features. This map is derived from GIS (geospatial information system) data. It represents a repackaging of GIS data in traditional map form, not creation of new information. The geospatial data in this map are from selected National Map data holdings and other government sources.
Layered geospatial PDF 7.5 Minute Quadrangle Map. Layers of geospatial data include orthoimagery, roads, grids, geographic names, elevation contours, hydrography, and other selected map features. This map is derived from GIS (geospatial information system) data. It represents a repackaging of GIS data in traditional map form, not creation of new information. The geospatial data in this map are from selected National Map data holdings and other government sources.
Layered geospatial PDF 7.5 Minute Quadrangle Map. Layers of geospatial data include orthoimagery, roads, grids, geographic names, elevation contours, hydrography, and other selected map features. This map is derived from GIS (geospatial information system) data. It represents a repackaging of GIS data in traditional map form, not creation of new information. The geospatial data in this map are from selected National Map data holdings and other government sources.
Layered geospatial PDF 7.5 Minute Quadrangle Map. Layers of geospatial data include orthoimagery, roads, grids, geographic names, elevation contours, hydrography, and other selected map features. This map is derived from GIS (geospatial information system) data. It represents a repackaging of GIS data in traditional map form, not creation of new information. The geospatial data in this map are from selected National Map data holdings and other government sources.
Layered geospatial PDF 7.5 Minute Quadrangle Map. Layers of geospatial data include orthoimagery, roads, grids, geographic names, elevation contours, hydrography, and other selected map features. This map is derived from GIS (geospatial information system) data. It represents a repackaging of GIS data in traditional map form, not creation of new information. The geospatial data in this map are from selected National Map data holdings and other government sources.
Layered geospatial PDF 7.5 Minute Quadrangle Map. Layers of geospatial data include orthoimagery, roads, grids, geographic names, elevation contours, hydrography, and other selected map features. This map is derived from GIS (geospatial information system) data. It represents a repackaging of GIS data in traditional map form, not creation of new information. The geospatial data in this map are from selected National Map data holdings and other government sources.
Layered geospatial PDF 7.5 Minute Quadrangle Map. Layers of geospatial data include orthoimagery, roads, grids, geographic names, elevation contours, hydrography, and other selected map features. This map is derived from GIS (geospatial information system) data. It represents a repackaging of GIS data in traditional map form, not creation of new information. The geospatial data in this map are from selected National Map data holdings and other government sources.
Layered geospatial PDF 7.5 Minute Quadrangle Map. Layers of geospatial data include orthoimagery, roads, grids, geographic names, elevation contours, hydrography, and other selected map features. This map is derived from GIS (geospatial information system) data. It represents a repackaging of GIS data in traditional map form, not creation of new information. The geospatial data in this map are from selected National Map data holdings and other government sources.
|

|
