Filters: Tags: Nassau County (X)
137 results (15ms)|
Filters
Contacts
(Less)
|
This data release contains coastal wetland synthesis products for the geographic region from Jamaica Bay to western Great South Bay, located in southeastern New York State. Metrics for resiliency, including unvegetated to vegetated ratio (UVVR), marsh elevation, and mean tidal range, are calculated for smaller units delineated from a Digital Elevation Model, providing the spatial variability of physical factors that influence wetland health. Through scientific efforts initiated with the Hurricane Sandy Science Plan, the U.S. Geological Survey has been expanding national assessment of coastal change hazards and forecast products to coastal wetlands with the intent of providing Federal, State, and local managers with...
Types: Map Service,
OGC WFS Layer,
OGC WMS Layer,
OGC WMS Service;
Tags: Atlantic Ocean,
Environmental Health,
Hydrology,
Jamaica Bay,
LTER,
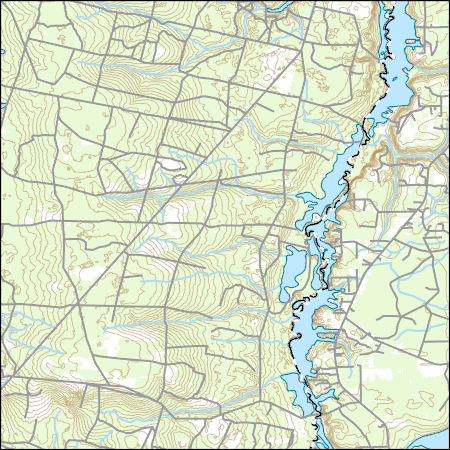
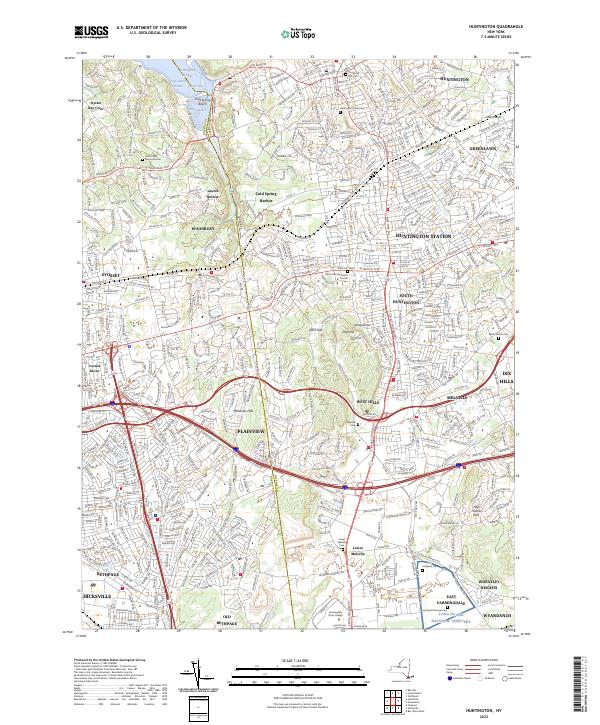
Layers of geospatial data include contours, boundaries, land cover, hydrography, roads, transportation, geographic names, structures, and other selected map features.
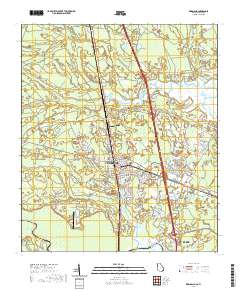
Layered geospatial PDF 7.5 Minute Quadrangle Map. Layers of geospatial data include orthoimagery, roads, grids, geographic names, elevation contours, hydrography, and other selected map features. This map is derived from GIS (geospatial information system) data. It represents a repackaging of GIS data in traditional map form, not creation of new information. The geospatial data in this map are from selected National Map data holdings and other government sources.
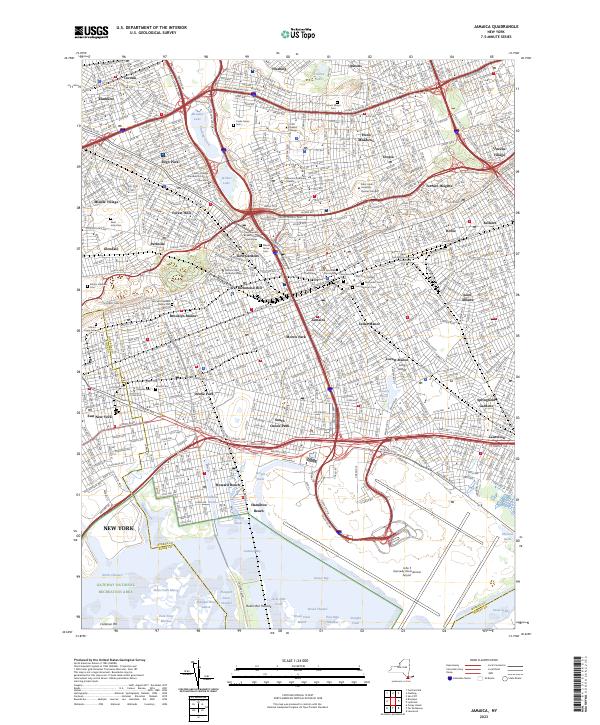
Layered geospatial PDF 7.5 Minute Quadrangle Map. Layers of geospatial data include orthoimagery, roads, grids, geographic names, elevation contours, hydrography, and other selected map features. This map is derived from GIS (geospatial information system) data. It represents a repackaging of GIS data in traditional map form, not creation of new information. The geospatial data in this map are from selected National Map data holdings and other government sources.
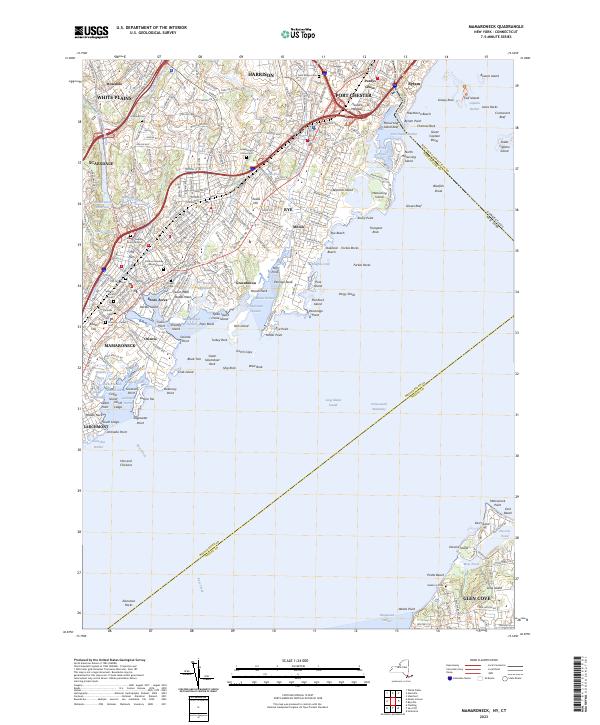
Layered geospatial PDF 7.5 Minute Quadrangle Map. Layers of geospatial data include orthoimagery, roads, grids, geographic names, elevation contours, hydrography, and other selected map features. This map is derived from GIS (geospatial information system) data. It represents a repackaging of GIS data in traditional map form, not creation of new information. The geospatial data in this map are from selected National Map data holdings and other government sources.
Layered geospatial PDF 7.5 Minute Quadrangle Map. Layers of geospatial data include orthoimagery, roads, grids, geographic names, elevation contours, hydrography, and other selected map features. This map is derived from GIS (geospatial information system) data. It represents a repackaging of GIS data in traditional map form, not creation of new information. The geospatial data in this map are from selected National Map data holdings and other government sources.
Layered geospatial PDF 7.5 Minute Quadrangle Map. Layers of geospatial data include orthoimagery, roads, grids, geographic names, elevation contours, hydrography, and other selected map features. This map is derived from GIS (geospatial information system) data. It represents a repackaging of GIS data in traditional map form, not creation of new information. The geospatial data in this map are from selected National Map data holdings and other government sources.
Layered geospatial PDF 7.5 Minute Quadrangle Map. Layers of geospatial data include orthoimagery, roads, grids, geographic names, elevation contours, hydrography, and other selected map features. This map is derived from GIS (geospatial information system) data. It represents a repackaging of GIS data in traditional map form, not creation of new information. The geospatial data in this map are from selected National Map data holdings and other government sources.
Background In recent years, more and more people have become concerned about Long Island's supply of freshwater. Currently, there is no comprehensive, island-wide resource that summarizes recent U.S. Geological Survey (USGS) research related to the Island's aquifer system. A webpage will be developed by the USGS that will compile published data from the hydrologic-surveillance program, in place since the mid-1970’s, and various USGS sources, and supplement this information with more recent seasonal and annual hydrologic technical assistance will be provided to the Suffolk County Water Authority (SCWA) to help them produce an easy to understand annual report that will provide a snapshot of the state of Long Island's...
Categories: Data,
Project;
Types: Downloadable,
Map Service,
OGC WFS Layer,
OGC WMS Layer,
Shapefile;
Tags: Cooperative Water Program,
GW or SW,
GW or SW,
GW or SW,
Geospatial Applications,
Layered geospatial PDF 7.5 Minute Quadrangle Map. Layers of geospatial data include orthoimagery, roads, grids, geographic names, elevation contours, hydrography, and other selected map features. This map is derived from GIS (geospatial information system) data. It represents a repackaging of GIS data in traditional map form, not creation of new information. The geospatial data in this map are from selected National Map data holdings and other government sources.
Layered geospatial PDF 7.5 Minute Quadrangle Map. Layers of geospatial data include orthoimagery, roads, grids, geographic names, elevation contours, hydrography, and other selected map features. This map is derived from GIS (geospatial information system) data. It represents a repackaging of GIS data in traditional map form, not creation of new information. The geospatial data in this map are from selected National Map data holdings and other government sources.
Layered geospatial PDF 7.5 Minute Quadrangle Map. Layers of geospatial data include orthoimagery, roads, grids, geographic names, elevation contours, hydrography, and other selected map features. This map is derived from GIS (geospatial information system) data. It represents a repackaging of GIS data in traditional map form, not creation of new information. The geospatial data in this map are from selected National Map data holdings and other government sources.
Layered geospatial PDF 7.5 Minute Quadrangle Map. Layers of geospatial data include orthoimagery, roads, grids, geographic names, elevation contours, hydrography, and other selected map features. This map is derived from GIS (geospatial information system) data. It represents a repackaging of GIS data in traditional map form, not creation of new information. The geospatial data in this map are from selected National Map data holdings and other government sources.
State and local county health departments have detected per- and polyfluoroalkyl substances (PFAS) in groundwater downgradient of airports and military and firefighting training areas in Long Island, New York. However, the occurrence and spatial distribution of PFAS throughout the surficial aquifer is not well established. Shallow groundwater samples were collected in 2018 from two observation well networks; the Sentinel network and Wastewater Treatment Plant groundwater (WTPGW) network. The Sentinel network is an island-wide group of wells screened within the shallow upper glacial (surficial, <100 feet deep) aquifer, which were sampled to assess the occurrence of PFAS in different land-use settings. The WTPGW network...
Categories: Data;
Types: Downloadable,
Map Service,
OGC WFS Layer,
OGC WMS Layer,
Shapefile;
Tags: Contaminants, Emerging,
Geochemistry,
Groundwater-Quality Monitoring,
Hydrology,
Long Island,
This model archive makes available the Soil-Water-Balance (SWB) model (Westenbroek and others, 2010) and input data used to estimate the potential amount of annual groundwater recharge to the Long Island aquifer system from 1900 to 2019 as described in U.S. Geological Survey Scientific Investigations Report 2021-5143. Input data for two SWB simulations are included in the archive. The first simulation uses existing land-use/land-cover datasets to estimate changes in recharge with changing land use from 1900-2019 (referred to as the post-development simulation). The second simulation assumed a forested, undeveloped (pre-development simulation) condition across Long Island for the same period. The same soil coverages...
Problem - The major hydrogeologic units of Long Island, New York, have been delineated as part of the islandwide mapping effort of Smolensky, Buxton, and Shernoff that was published in 1989 as U.S. Geological Survey (USGS) Hydrologic Atlas (HA) 709. Concern about local details in the hydrogeologic framework that may not be represented in HA-709 has led the USGS, in cooperation with the U.S. Environmental Protection Agency (EPA), to assess the hydrogeology of the Long Island area so ground-water-flow modeling planned by EPA can more fully reflect local hydrogeologic conditions. Objectives - The primary objective of this project is to construct geographic information system (GIS) datasets of the altitudes of the...
Layered geospatial PDF 7.5 Minute Quadrangle Map. Layers of geospatial data include orthoimagery, roads, grids, geographic names, elevation contours, hydrography, and other selected map features. This map is derived from GIS (geospatial information system) data. It represents a repackaging of GIS data in traditional map form, not creation of new information. The geospatial data in this map are from selected National Map data holdings and other government sources.
Layered geospatial PDF 7.5 Minute Quadrangle Map. Layers of geospatial data include orthoimagery, roads, grids, geographic names, elevation contours, hydrography, and other selected map features. This map is derived from GIS (geospatial information system) data. It represents a repackaging of GIS data in traditional map form, not creation of new information. The geospatial data in this map are from selected National Map data holdings and other government sources.
This data release contains model simulation results of a particle tracking analysis to delineate areas that provide recharge to surface waters and public-supply wells on Long Island, NY. The analysis partitions the recharge areas based on particle travel times of greater than or less than 10 years to reach the receiving surface water or well. The simulation was performed using a regional-scale numerical model of the Long Island aquifer system (Walter and others, 2020a and 2020b) for average 2005-2015 conditions. The model implements MODFLOW-NWT (Niswonger and others, 2011) to represent steady-state groundwater pumping and aquifer recharge conditions; recharge areas were identified and partitioned using the particle-tracking...

A previously developed three-dimensional steady-state groundwater flow model (https://doi.org/10.3133/sir20205091) is used to assist resource managers and planners in developing informed strategies to address nitrogen loading to coastal water bodies of Long Island, New York. Coastal water bodies of Long Island are important economic and recreational resources for the region. Therefore, the U.S. Geological Survey and New York State Department of Environmental Conservation initiated a program to delineate a comprehensive dataset of CAs (or areas contributing groundwater), travel times, and groundwater discharges to streams, lakes, marine-surface waters, and subsea discharge boundaries. The 25-layer regional groundwater-flow...
|

|
