Filters: Tags: Nassau County (X)
137 results (32ms)|
Filters
Date Range
Extensions Types
Contacts
Categories Tag Types
|
This data release contains coastal wetland synthesis products for the geographic region of north shore Long Island, New York. Metrics for resiliency, including unvegetated to vegetated ratio (UVVR), marsh elevation, and mean tidal range, are calculated for smaller units delineated from a Digital Elevation Model, providing the spatial variability of physical factors that influence wetland health. Through scientific efforts initiated with the Hurricane Sandy Science Plan, the U.S. Geological Survey has been expanding national assessment of coastal change hazards and forecast products to coastal wetlands with the intent of providing Federal, State, and local managers with tools to estimate the vulnerability and ecosystem...
Categories: Data;
Types: Downloadable,
Map Service,
OGC WFS Layer,
OGC WMS Layer,
Shapefile;
Tags: Atlantic Ocean,
LTER,
Long Island Sound,
Long-Term Ecological Research,
Nassau County,
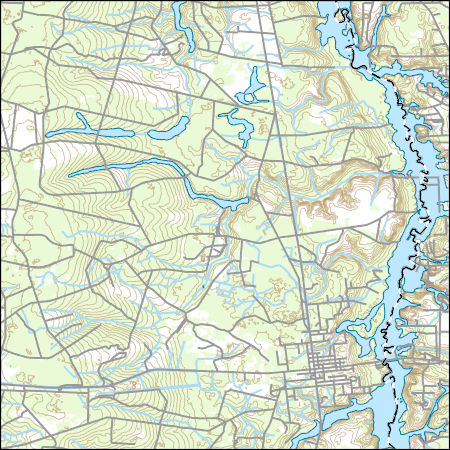
Layers of geospatial data include contours, boundaries, land cover, hydrography, roads, transportation, geographic names, structures, and other selected map features.
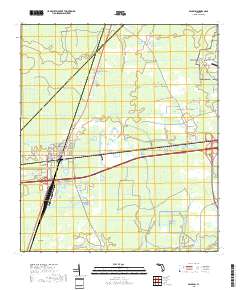
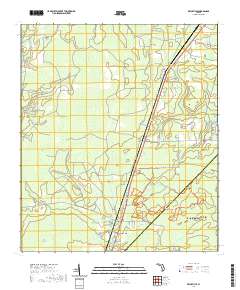
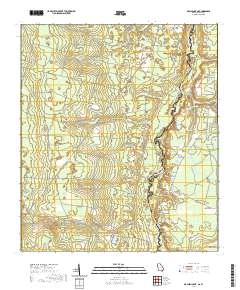
Layered geospatial PDF 7.5 Minute Quadrangle Map. Layers of geospatial data include orthoimagery, roads, grids, geographic names, elevation contours, hydrography, and other selected map features. This map is derived from GIS (geospatial information system) data. It represents a repackaging of GIS data in traditional map form, not creation of new information. The geospatial data in this map are from selected National Map data holdings and other government sources.
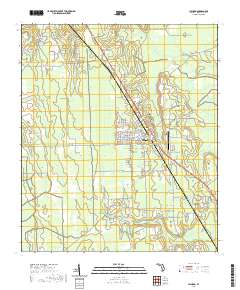
Layered geospatial PDF 7.5 Minute Quadrangle Map. Layers of geospatial data include orthoimagery, roads, grids, geographic names, elevation contours, hydrography, and other selected map features. This map is derived from GIS (geospatial information system) data. It represents a repackaging of GIS data in traditional map form, not creation of new information. The geospatial data in this map are from selected National Map data holdings and other government sources.
The U.S. Geological Survey (USGS) is providing online maps of water-table and potentiometric-surface altitude in the upper glacial, Magothy, Jameco, Lloyd, and North Shore aquifers on Long Island, New York, April–May 2016. Also provided is a depth-to-water map for Long Island, New York, April–May 2016. The USGS makes these maps and geospatial data available as REST Open Map Services (as well as HTTP, JSON, KML, and shapefile), so end-users can consume them on mobile and web clients. A companion report, U.S. Geological Survey Scientific Investigations Map 3398 (Como and others, 2018; https://doi.org/10.3133/sim3398) further describes data collection and map preparation and presents 68x22 in. Portable Document...
Categories: Data;
Types: ArcGIS REST Map Service,
ArcGIS Service Definition,
Downloadable,
Map Service;
Tags: Long Island,
Nassau County,
New York,
Suffolk County,
depth to water,
The U.S. Geological Survey (USGS) is providing online maps of water-table and potentiometric-surface altitude in the upper glacial, Magothy, Jameco, Lloyd, and North Shore aquifers on Long Island, New York, April–May 2016. Also provided is a depth-to-water map for Long Island, New York, April–May 2016. The USGS makes these maps and geospatial data available as REST Open Map Services (as well as HTTP, JSON, KML, and shapefile), so end-users can consume them on mobile and web clients. A companion report, U.S. Geological Survey Scientific Investigations Map 3398 (Como and others, 2018; https://doi.org/10.3133/sim3398) further describes data collection and map preparation and presents 68x22 in. Portable Document...
Categories: Data;
Types: ArcGIS REST Map Service,
ArcGIS Service Definition,
Citation,
Downloadable,
Map Service;
Tags: Contours,
Groundwater,
Hydrology,
Levels,
Lloyd aquifer,
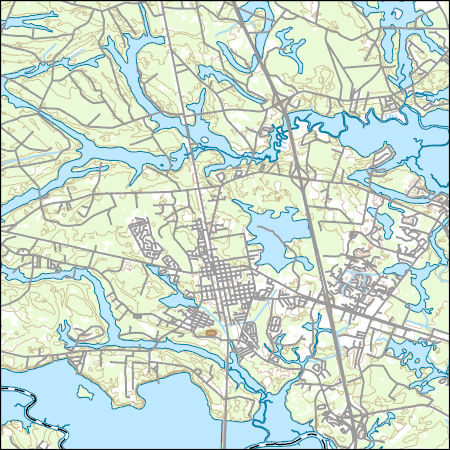
Layers of geospatial data include contours, boundaries, land cover, hydrography, roads, transportation, geographic names, structures, and other selected map features.
This data release contains coastal wetland synthesis products for the geographic region from Jamaica Bay to western Great South Bay, located in southeastern New York State. Metrics for resiliency, including unvegetated to vegetated ratio (UVVR), marsh elevation, and mean tidal range, are calculated for smaller units delineated from a Digital Elevation Model, providing the spatial variability of physical factors that influence wetland health. Through scientific efforts initiated with the Hurricane Sandy Science Plan, the U.S. Geological Survey has been expanding national assessment of coastal change hazards and forecast products to coastal wetlands with the intent of providing Federal, State, and local managers with...
Categories: Data;
Types: Downloadable,
Map Service,
OGC WFS Layer,
OGC WMS Layer,
Shapefile;
Tags: Atlantic Ocean,
Jamaica Bay,
LTER,
Long-Term Ecological Research,
Nassau County,
This data release contains coastal wetland synthesis products for the geographic region of north shore Long Island, New York. Metrics for resiliency, including unvegetated to vegetated ratio (UVVR), marsh elevation, and mean tidal range, are calculated for smaller units delineated from a Digital Elevation Model, providing the spatial variability of physical factors that influence wetland health. Through scientific efforts initiated with the Hurricane Sandy Science Plan, the U.S. Geological Survey has been expanding national assessment of coastal change hazards and forecast products to coastal wetlands with the intent of providing Federal, State, and local managers with tools to estimate the vulnerability and ecosystem...
Categories: Data;
Types: Downloadable,
Map Service,
OGC WFS Layer,
OGC WMS Layer,
Shapefile;
Tags: Atlantic Ocean,
LTER,
Long Island Sound,
Long-Term Ecological Research,
Nassau County,
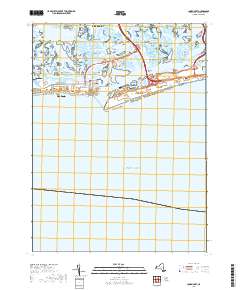
Layered geospatial PDF 7.5 Minute Quadrangle Map. Layers of geospatial data include orthoimagery, roads, grids, geographic names, elevation contours, hydrography, and other selected map features. This map is derived from GIS (geospatial information system) data. It represents a repackaging of GIS data in traditional map form, not creation of new information. The geospatial data in this map are from selected National Map data holdings and other government sources.
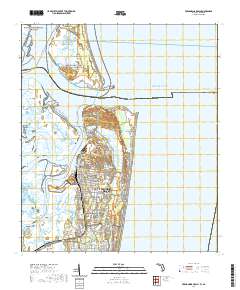
Layered geospatial PDF 7.5 Minute Quadrangle Map. Layers of geospatial data include orthoimagery, roads, grids, geographic names, elevation contours, hydrography, and other selected map features. This map is derived from GIS (geospatial information system) data. It represents a repackaging of GIS data in traditional map form, not creation of new information. The geospatial data in this map are from selected National Map data holdings and other government sources.
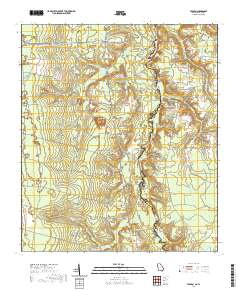
Layered geospatial PDF 7.5 Minute Quadrangle Map. Layers of geospatial data include orthoimagery, roads, grids, geographic names, elevation contours, hydrography, and other selected map features. This map is derived from GIS (geospatial information system) data. It represents a repackaging of GIS data in traditional map form, not creation of new information. The geospatial data in this map are from selected National Map data holdings and other government sources.
Layered geospatial PDF 7.5 Minute Quadrangle Map. Layers of geospatial data include orthoimagery, roads, grids, geographic names, elevation contours, hydrography, and other selected map features. This map is derived from GIS (geospatial information system) data. It represents a repackaging of GIS data in traditional map form, not creation of new information. The geospatial data in this map are from selected National Map data holdings and other government sources.
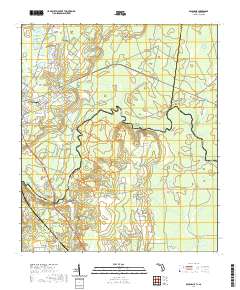
Layered geospatial PDF 7.5 Minute Quadrangle Map. Layers of geospatial data include orthoimagery, roads, grids, geographic names, elevation contours, hydrography, and other selected map features. This map is derived from GIS (geospatial information system) data. It represents a repackaging of GIS data in traditional map form, not creation of new information. The geospatial data in this map are from selected National Map data holdings and other government sources.
The U.S. Geological Survey (USGS) is providing online maps of water-table and potentiometric-surface altitude in the upper glacial, Magothy, Jameco, Lloyd, and North Shore aquifers on Long Island, New York, April–May 2016. Also provided is a depth-to-water map for Long Island, New York, April–May 2016. The USGS makes these maps and geospatial data available as REST Open Map Services (as well as HTTP, JSON, KML, and shapefile), so end-users can consume them on mobile and web clients. A companion report, U.S. Geological Survey Scientific Investigations Map 3398 (Como and others, 2018; https://doi.org/10.3133/sim3398) further describes data collection and map preparation and presents 68x22 in. Portable Document...
Categories: Data;
Types: ArcGIS REST Map Service,
ArcGIS Service Definition,
Citation,
Downloadable,
Map Service;
Tags: Contours,
Groundwater,
Hydrology,
Levels,
Long Island,
During October-November 2017 twelve time domain electromagnetic (TDEM) surveys were collected in Nassau and Queens County. The data were collected to estimate the extent of saltwater intrusion in support of the Long Island Groundwater Sustainability Project in cooperation with the New York State Department of Environmental Conservation. In the TDEM method, an electrical current is run through a wire in a transmitter loop, which in turn produces a magnetic field. The strength of the magnetic field is proportional to the strength of the electrical current. The current is rapidly shut off and due to Faraday’s Law, a secondary current is induced. The strength of the secondary current is proportional to the rate of...
Layered geospatial PDF 7.5 Minute Quadrangle Map. Layers of geospatial data include orthoimagery, roads, grids, geographic names, elevation contours, hydrography, and other selected map features. This map is derived from GIS (geospatial information system) data. It represents a repackaging of GIS data in traditional map form, not creation of new information. The geospatial data in this map are from selected National Map data holdings and other government sources.
This data release contains geospatial data defining estimates of the depth to water and water-table altitude in the upper glacial and Magothy Aquifers, the potentiometric surface of the confined Magothy and Jameco Aquifers, and the potentiometric surface of the Lloyd and North Shore Aquifers on Long Island, New York. Estimates are based on 502 water-level measurements made in wells across Long Island during March-April 2006. Water-table contours were interpolated using measurements from 341 wells screened in the upper glacial aquifer or shallow Magothy Aquifer. Potentiometric-surface contours in the confined Magothy and hydraulically connected Jameco Aquifer were interpolated using measurements from 102 wells. Potentiometric-surface...
Groundwater samples collected between 2016 and 2018 from 56 shallow (<40 m depth) monitoring wells in Long Island, N.Y., were collected in support of the Long Island Pesticide Pollution Prevention Strategy. Each well was sampled at least once and analyzed for over 200 pesticides and pesticide degradates as part of this study. Results presented here also include field and inorganic analysis data, as well as neonicotinoid (LC9045) and glyphosate pesticide data collected from select monitoring wells. Data collection and analysis was supported by the New York State Department of Environmental Conservation, Suffolk County Department of Health Services, and Long Island Commission for Aquifer Protection. The results presented...
Categories: Data;
Tags: Groundwater-Quality Monitoring,
Long Island,
Nassau County,
New York,
Suffolk County,
This data release contains the input, output, and model code used to run a transient simulation of a previously published (Walter and others, 2020) steady-state regional model of Long Island, N.Y. The original model code was updated to MODFLOW 6 (version 6.3.0) and incorporates monthly transient stress periods to simulate conditions from 2005-2019 following methods described in Walter and others (2020). Selected remedial stresses (groundwater extraction and return) were incorporated for select locations in southeastern Nassau County. No modifications were made to the hydrologic boundaries, model layers, or hydraulic properties specified in the original model. A uniform value of 0.25 was used to represent specific...
|

|
