Filters: Tags: Nassau County (X)
137 results (83ms)|
Filters
Date Range
Extensions Types
Contacts
Categories Tag Types
|

Layers of geospatial data include contours, boundaries, land cover, hydrography, roads, transportation, geographic names, structures, and other selected map features.
Layers of geospatial data include contours, boundaries, land cover, hydrography, roads, transportation, geographic names, structures, and other selected map features.
Layers of geospatial data include contours, boundaries, land cover, hydrography, roads, transportation, geographic names, structures, and other selected map features.
Layers of geospatial data include contours, boundaries, land cover, hydrography, roads, transportation, geographic names, structures, and other selected map features.
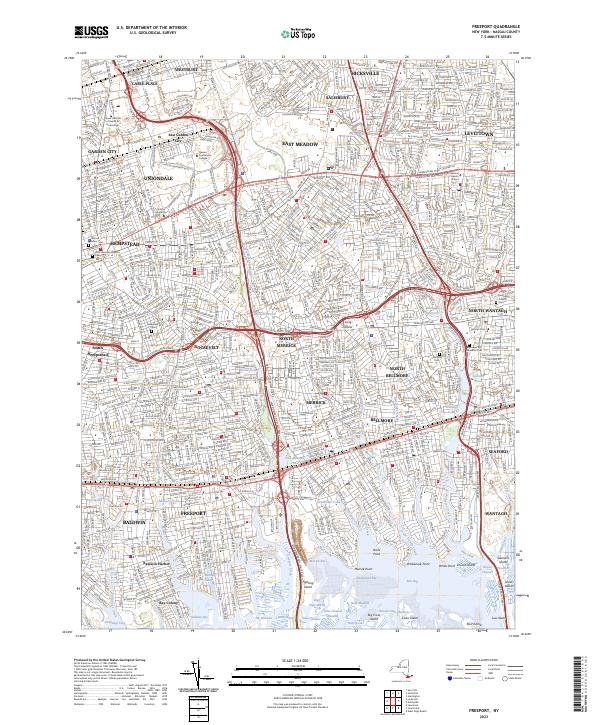
Layered geospatial PDF 7.5 Minute Quadrangle Map. Layers of geospatial data include orthoimagery, roads, grids, geographic names, elevation contours, hydrography, and other selected map features. This map is derived from GIS (geospatial information system) data. It represents a repackaging of GIS data in traditional map form, not creation of new information. The geospatial data in this map are from selected National Map data holdings and other government sources.
The U.S. Geological Survey (USGS) is providing an online map of water-table altitude contours in the upper glacial and Magothy aquifers on Long Island, New York, April-May 2013. USGS serves this map and geospatial data as a REST Open Map Service (as well as HTTP, JSON, KML, and shapefile), so end-users can use the map and data on mobile and web clients. A companion report, U.S. Geological Survey Scientific Investigations Map 3326 (Como and others, 2015; http://dx.doi.org/10.3133/sim3326) further describes data collection and map preparation and presents 68x22 in. PDF versions, 4 sheets, scale 1:125,000. This polyline shapefile consists of digital contours that represent the water table altitude in the upper...
Categories: Data,
Publication;
Types: ArcGIS REST Map Service,
ArcGIS Service Definition,
Citation,
Downloadable,
Map Service;
Tags: Contours,
Geospatial Applications,
Groundwater,
Hydrology,
Information Visualization,
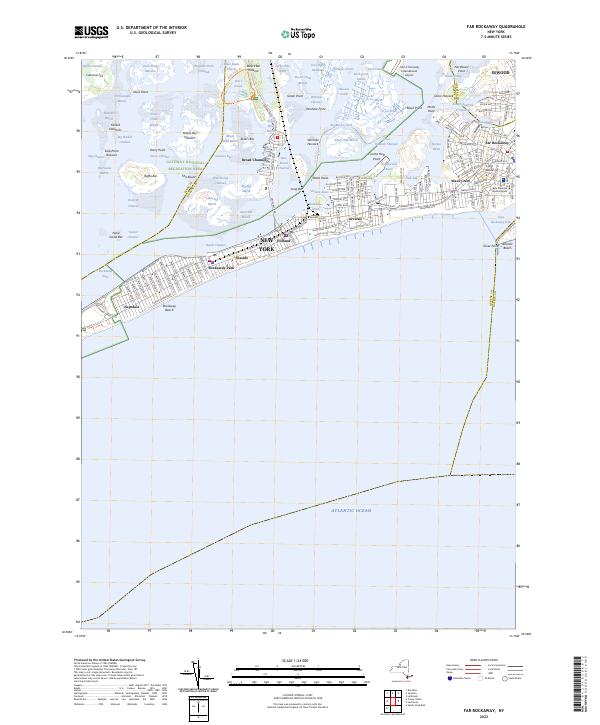
Layered geospatial PDF 7.5 Minute Quadrangle Map. Layers of geospatial data include orthoimagery, roads, grids, geographic names, elevation contours, hydrography, and other selected map features. This map is derived from GIS (geospatial information system) data. It represents a repackaging of GIS data in traditional map form, not creation of new information. The geospatial data in this map are from selected National Map data holdings and other government sources.
Layered geospatial PDF 7.5 Minute Quadrangle Map. Layers of geospatial data include orthoimagery, roads, grids, geographic names, elevation contours, hydrography, and other selected map features. This map is derived from GIS (geospatial information system) data. It represents a repackaging of GIS data in traditional map form, not creation of new information. The geospatial data in this map are from selected National Map data holdings and other government sources.
Layered geospatial PDF 7.5 Minute Quadrangle Map. Layers of geospatial data include orthoimagery, roads, grids, geographic names, elevation contours, hydrography, and other selected map features. This map is derived from GIS (geospatial information system) data. It represents a repackaging of GIS data in traditional map form, not creation of new information. The geospatial data in this map are from selected National Map data holdings and other government sources.
Layered geospatial PDF 7.5 Minute Quadrangle Map. Layers of geospatial data include orthoimagery, roads, grids, geographic names, elevation contours, hydrography, and other selected map features. This map is derived from GIS (geospatial information system) data. It represents a repackaging of GIS data in traditional map form, not creation of new information. The geospatial data in this map are from selected National Map data holdings and other government sources.
A Geographic Information System (GIS) shapefile and summary tables of the extent of irrigated agricultural land-use are provided for eleven counties fully or partially within the St. Johns River Water Management District (full-county extents of: Brevard, Clay, Duval, Flagler, Indian River, Nassau, Osceola, Putnam, Seminole, St. Johns, and Volusia counties). These files were compiled through a cooperative project between the U.S. Geological Survey and the Florida Department of Agriculture and Consumer Services, Office of Agricultural Water Policy. Information provided in the shapefile includes the location of irrigated lands that were verified during field surveying that started in November 2022 and concluded in...
This data release contains geospatial data defining estimates of the depth to water and water-table altitude in the upper glacial and Magothy Aquifers, the potentiometric surface of the confined Magothy and Jameco Aquifers, and the potentiometric surface of the Lloyd and North Shore Aquifers on Long Island, New York. Estimates are based on 502 water-level measurements made in wells across Long Island during April-May 2010. Water-table contours were interpolated using measurements from 349 wells screened in the upper glacial aquifer or shallow Magothy Aquifer. Potentiometric-surface contours in the confined Magothy and hydraulically connected Jameco Aquifer were interpolated using measurements from 94 wells. Potentiometric-surface...
Layered geospatial PDF 7.5 Minute Quadrangle Map. Layers of geospatial data include orthoimagery, roads, grids, geographic names, elevation contours, hydrography, and other selected map features. This map is derived from GIS (geospatial information system) data. It represents a repackaging of GIS data in traditional map form, not creation of new information. The geospatial data in this map are from selected National Map data holdings and other government sources.
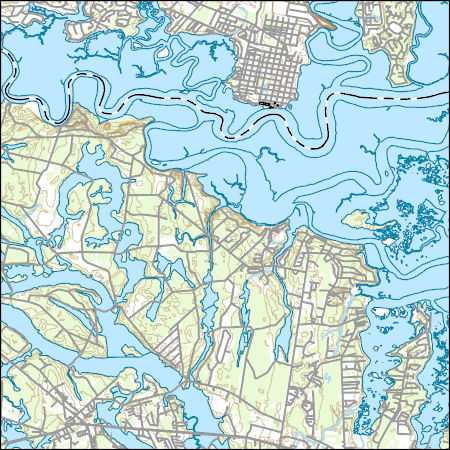
This data release contains coastal wetland synthesis products for the geographic region of north shore Long Island, New York. Metrics for resiliency, including unvegetated to vegetated ratio (UVVR), marsh elevation, and mean tidal range, are calculated for smaller units delineated from a Digital Elevation Model, providing the spatial variability of physical factors that influence wetland health. Through scientific efforts initiated with the Hurricane Sandy Science Plan, the U.S. Geological Survey has been expanding national assessment of coastal change hazards and forecast products to coastal wetlands with the intent of providing Federal, State, and local managers with tools to estimate the vulnerability and ecosystem...
Layers of geospatial data include contours, boundaries, land cover, hydrography, roads, transportation, geographic names, structures, and other selected map features.
This data release contains coastal wetland synthesis products for the geographic region from Jamaica Bay to western Great South Bay, located in southeastern New York State. Metrics for resiliency, including unvegetated to vegetated ratio (UVVR), marsh elevation, and mean tidal range, are calculated for smaller units delineated from a Digital Elevation Model, providing the spatial variability of physical factors that influence wetland health. Through scientific efforts initiated with the Hurricane Sandy Science Plan, the U.S. Geological Survey has been expanding national assessment of coastal change hazards and forecast products to coastal wetlands with the intent of providing Federal, State, and local managers with...
Categories: Data;
Types: Downloadable,
Map Service,
OGC WFS Layer,
OGC WMS Layer,
Shapefile;
Tags: Atlantic Ocean,
Jamaica Bay,
LTER,
Long-Term Ecological Research,
Nassau County,
This data release contains coastal wetland synthesis products for the geographic region of north shore Long Island, New York. Metrics for resiliency, including unvegetated to vegetated ratio (UVVR), marsh elevation, mean tidal range, and shoreline change rate are calculated for smaller units delineated from a Digital Elevation Model, providing the spatial variability of physical factors that influence wetland health. Through scientific efforts initiated with the Hurricane Sandy Science Plan, the U.S. Geological Survey has been expanding national assessment of coastal change hazards and forecast products to coastal wetlands with the intent of providing Federal, State, and local managers with tools to estimate the...
Categories: Data;
Types: Downloadable,
Map Service,
OGC WFS Layer,
OGC WMS Layer,
Shapefile;
Tags: Atlantic Ocean,
Long Island Sound,
Nassau County,
New York,
Suffolk County,
Layered geospatial PDF 7.5 Minute Quadrangle Map. Layers of geospatial data include orthoimagery, roads, grids, geographic names, elevation contours, hydrography, and other selected map features. This map is derived from GIS (geospatial information system) data. It represents a repackaging of GIS data in traditional map form, not creation of new information. The geospatial data in this map are from selected National Map data holdings and other government sources.
Layered geospatial PDF 7.5 Minute Quadrangle Map. Layers of geospatial data include orthoimagery, roads, grids, geographic names, elevation contours, hydrography, and other selected map features. This map is derived from GIS (geospatial information system) data. It represents a repackaging of GIS data in traditional map form, not creation of new information. The geospatial data in this map are from selected National Map data holdings and other government sources.
|

|
