Filters: Tags: National Forest (X)
80 results (31ms)|
Filters
|

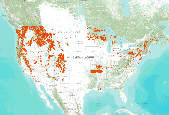
This map layer consists of federally owned or administered lands of the United States, Puerto Rico, and the U.S. Virgin Islands. For the most part, only areas of 320 acres or more are included; some smaller areas deemed to be important or significant are also included. There may be private inholdings within the boundaries of Federal lands in this map layer. Some established Federal lands which are larger than 320 acres are not included in this map layer, because their boundaries were not available from the owning or administering agency.

This dataset is a compilation of forest insect, disease and abiotic damage mapped by aerial detection surveys on forested areas in the United States. At this time, the National Aerial Survey Data Standards require only mortality and defoliation data be collected and reported. However, many cooperators collect data on other types of damage and therefore, the national database has been designed to accommodate these data. Low-level flights, typically 1,000 to 2,000 feet above ground level, are used to map forest damage. Observers use paper maps, typically 1:100,000 scale USGS maps, upon which they record the damage. There is also a digital sketchmap system that may be used. The digital system uses GPS to display the...

This dataset is a compilation of forest insect, disease and abiotic damage mapped by aerial detection surveys on forested areas in the United States. At this time, the National Aerial Survey Data Standards require only mortality and defoliation data be collected and reported. However, many cooperators collect data on other types of damage and therefore, the national database has been designed to accommodate these data. Low-level flights, typically 1,000 to 2,000 feet above ground level, are used to map forest damage. Observers use paper maps, typically 1:100,000 scale USGS maps, upon which they record the damage. There is also a digital sketchmap system that may be used. The digital system uses GPS to display the...

This map layer shows Indian lands of the United States. For the most part, only areas of 320 acres or more are included; some smaller areas deemed to be important or significant are also included. Federally-administered lands within a reservation are included for continuity; these may or may not be considered part of the reservation and are simply described with their feature type and the administrating Federal agency. Some established Indian lands which are larger than 320 acres are not included in this map layer because their boundaries were not available from the owning or administering agency.

The 2006 National Insect and Disease Risk Map (NIDRM) Project integrates 188 individual risk models constructed within a common, consistent framework that accounts for regional variations in current and future forest health. The 2006 risk assessment, conducted within the contiguous United States and Alaska, provides a consistent, repeatable, transparent process through which interactive spatial and temporal risk assessments can be conducted at various scales to aid in the allocation of resources for forest health management. This modeling process is intended to increase the utilization of forest health risk maps within and outside the National Forest System and encourage development of future risk maps. NIDRM...
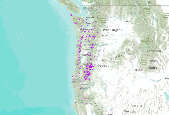
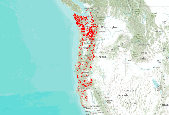
This dataset is a compilation of forest insect, disease and abiotic damage mapped by aerial detection surveys on forested areas in the United States. At this time, the National Aerial Survey Data Standards require only mortality and defoliation data be collected and reported. However, many cooperators collect data on other types of damage and therefore, the national database has been designed to accommodate these data. Low-level flights, typically 1,000 to 2,000 feet above ground level, are used to map forest damage. Observers use paper maps, typically 1:100,000 scale USGS maps, upon which they record the damage. There is also a digital sketchmap system that may be used. The digital system uses GPS to display the...
This dataset is a compilation of forest insect, disease and abiotic damage mapped by aerial detection surveys on forested areas in the United States. At this time, the National Aerial Survey Data Standards require only mortality and defoliation data be collected and reported. However, many cooperators collect data on other types of damage and therefore, the national database has been designed to accommodate these data. Low-level flights, typically 1,000 to 2,000 feet above ground level, are used to map forest damage. Observers use paper maps, typically 1:100,000 scale USGS maps, upon which they record the damage. There is also a digital sketchmap system that may be used. The digital system uses GPS to display the...

This dataset is a compilation of forest insect, disease and abiotic damage mapped by aerial detection surveys on forested areas in the United States. At this time, the National Aerial Survey Data Standards require only mortality and defoliation data be collected and reported. However, many cooperators collect data on other types of damage and therefore, the national database has been designed to accommodate these data. Low-level flights, typically 1,000 to 2,000 feet above ground level, are used to map forest damage. Observers use paper maps, typically 1:100,000 scale USGS maps, upon which they record the damage. There is also a digital sketchmap system that may be used. The digital system uses GPS to display the...

The acquisition of forest parameters by host species distributions is a significant factor in the identification of areas at risk of mortality to a particular agent. The most readily-available forest type maps do not contain enough location-specific information for insect and disease risk assessments, in particular species' age and stocking. Estimates for total and individual species' basal area (BA), quadratic mean diameter (QMD), stand density index (SDI), percent host composition, and predominant canopy position were developed for all 57 tree species and species groups modeled for the National Insect and Disease Risk Map. After extensively testing various interpolation methods, the Risk Map Integration Team...

The 2006 National Insect and Disease Risk Map (NIDRM) Project integrates 188 individual risk models constructed within a common, consistent framework that accounts for regional variations in current and future forest health. The 2006 risk map assessment, utilized within the contiguous United States and Alaska, provides a consistent, repeatable, transparent process through which interactive spatial and temporal risk assessments can be conducted at various scales to aid in the allocation of resources for forest health management. This modeling process is intended to increase the utilization of forest health risk maps within and outside the National Forest System and encourage development of future risk maps. NIDRM...

Rocky Mountain Region GIS Data Library Our geographic area of responsibility covers Colorado, Kansas, Nebraska, South Dakota, and Wyoming.
This dataset is a compilation of forest insect, disease and abiotic damage mapped by aerial detection surveys on forested areas in the United States. At this time, the National Aerial Survey Data Standards require only mortality and defoliation data be collected and reported. However, many cooperators collect data on other types of damage and therefore, the national database has been designed to accommodate these data. Low-level flights, typically 1,000 to 2,000 feet above ground level, are used to map forest damage. Observers use paper maps, typically 1:100,000 scale USGS maps, upon which they record the damage. There is also a digital sketchmap system that may be used. The digital system uses GPS to display the...

The acquisition of host species distributions is a significant factor in the identification of areas at risk of mortality to a particular agent. The most readily-available forest type maps do not contain enough location-specific information for insect and disease risk assessments, in particular species' age and stocking. Estimates for total and individual species' basal area (BA), quadratic mean diameter (QMD), stand density index (SDI), percent host composition, and predominant canopy position were developed for all 57 tree species and species groups modeled for the National Insect and Disease Risk Map. After extensively testing various interpolation methods, the Risk Map Integration Team (RMIT) utilized a...

Two maps (PCT_BALOSS_AK - the ArcInfo Grid referenced to this metadata - and PCT_BALOSS - see accompanying CONUS Grid and its associated metadata) represent, in map form, the comprehensive version of the final results of the 2006 National Insect and Disease Risk Map (NIDRM) Project. Specifically, their pixel values range from 0 to 100 percent, representing the predicted percent of basal area loss over the next 15 years due to insects and diseases.
This is part of a 3-tiered dataset consisting ofIDS_shapes: footprint polygon featuresIDS_attrib: attribute descriptions of polygonsIDS_rollup: lookup information for features that are summarized as a group (rollup)This dataset is a compilation of forest insect, disease and abiotic damage mapped by aerial detection surveys on forested areas in the United States. At this time, the National Aerial Survey Data Standards require only mortality and defoliation data be collected and reported. However, many cooperators collect data on other types of damage and therefore, the national database has been designed to accommodate these data. Low-level flights, typically 1,000 to 2,000 feet above ground level, are used to map...
Land & Resource Management Plan (L&RMP) Land Suitability Class This is a derived layer of forestland capability, suitability and availability for timber production. Water is assigned census or non-census water using the water bodies layer. Land is assigned to forest or non-forest using existing vegetation. Forestland both capable (productive) and other (non-productive) forestland, as well as non-forest are determined by CALVEG types (TABLE 38). Each CALVEG type is assigned a forest productivity code (TABLE 43). Suitability information is derived from productive forest CALVEG types that are available, minus the unsuitable forestlands (UNSU). Availability (TABLE 11) is derived by determining all forestland from CALVEG...
Land & Resource Management Plan (L&RMP) Land Suitability Class This is a derived layer of forestland capability, suitability and availability for timber production. Water is assigned census or non-census water using the water bodies layer. Land is assigned to forest or non-forest using existing vegetation. Forestland both capable (productive) and other (non-productive) forestland, as well as non-forest are determined by CALVEG types (TABLE 38). Each CALVEG type is assigned a forest productivity code (TABLE 43). Suitability information is derived from productive forest CALVEG types that are available, minus the unsuitable forestlands (UNSU). Availability (TABLE 11) is derived by determining all forestland from CALVEG...

This dataset is a compilation of forest insect, disease and abiotic damage mapped by aerial detection surveys on forested areas in the United States. At this time, the National Aerial Survey Data Standards require only mortality and defoliation data be collected and reported. However, many cooperators collect data on other types of damage and therefore, the national database has been designed to accommodate these data. Low-level flights, typically 1,000 to 2,000 feet above ground level, are used to map forest damage. Observers use paper maps, typically 1:100,000 scale USGS maps, upon which they record the damage. There is also a digital sketchmap system that may be used. The digital system uses GPS to display the...

This dataset is a compilation of forest insect, disease and abiotic damage mapped by aerial detection surveys on forested areas in the United States. At this time, the National Aerial Survey Data Standards require only mortality and defoliation data be collected and reported. However, many cooperators collect data on other types of damage and therefore, the national database has been designed to accommodate these data. Low-level flights, typically 1,000 to 2,000 feet above ground level, are used to map forest damage. Observers use paper maps, typically 1:100,000 scale USGS maps, upon which they record the damage. There is also a digital sketchmap system that may be used. The digital system uses GPS to display the...

Two maps (this grid, CONUS_BALOSSI and AK_BALOSSI - see accompanying Grid and its associated metadata) represent, in map form, the total potential BA loss resulting from the application of the 2006 National Insect and Disease Risk Map (NIDRM) Project. Specifically, it is the compilation of all BA losses resulting from running all 188 models of agent/host interactions which result in mortality.
|

|
