Filters: Tags: National Forest (X)
80 results (132ms)|
Filters
Date Range
Extensions Types Contacts
Categories Tag Types Tag Schemes
|

This map layer consists of federally owned or administered lands of the United States, Puerto Rico, and the U.S. Virgin Islands. For the most part, only areas of 320 acres or more are included; some smaller areas deemed to be important or significant are also included. There may be private inholdings within the boundaries of Federal lands in this map layer. Some established Federal lands which are larger than 320 acres are not included in this map layer, because their boundaries were not available from the owning or administering agency.
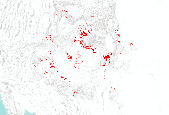
This is part of a 3-tiered dataset consisting ofIDS_shapes: footprint polygon featuresIDS_attrib: attribute descriptions of polygonsIDS_rollup: lookup information for features that are summarized as a group (rollup)This dataset is a compilation of forest insect, disease and abiotic damage mapped by aerial detection surveys on forested areas in the United States. At this time, the National Aerial Survey Data Standards require only mortality and defoliation data be collected and reported. However, many cooperators collect data on other types of damage and therefore, the national database has been designed to accommodate these data. Low-level flights, typically 1,000 to 2,000 feet above ground level, are used to map...
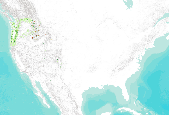
These data display national forest and ranger district boundaries for Region 1, 2 and 4. Note that many private and state-owned parcels lie within the national forest boundaries depicted in these data. Note that these data do not conform entirely with official national forest boundaries: (1) the boundaries included here have been expanded to encompass national forest system lands that lie outside of the official forest boundary and (2) many small and discrete polygons that have no national forest ownership but were (and are) included in the officially designated forest boundary are not included in these data. To obtain actual boundaries use most accurate land management data layer.
This GIS coverage displays all of the congressionally designated wilderness areas found within the Shoshone National Forest. Much of the Forest is within designated wilderness areas.
Categories: Data;
Types: Downloadable;
Tags: Federal Government,
Shoshone National Forest,
US Forest Service,
USFS,
Wyoming State,

This dataset is a compilation of forest insect, disease and abiotic damage mapped by aerial detection surveys on forested areas in the United States. At this time, the National Aerial Survey Data Standards require only mortality and defoliation data be collected and reported. However, many cooperators collect data on other types of damage and therefore, the national database has been designed to accommodate these data. Low-level flights, typically 1,000 to 2,000 feet above ground level, are used to map forest damage. Observers use paper maps, typically 1:100,000 scale USGS maps, upon which they record the damage. There is also a digital sketchmap system that may be used. The digital system uses GPS to display the...

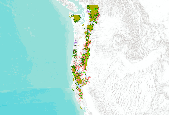
This layer depicts montane meadow vegetation on National Forests in the Sierra Nevada range. Meadows are wet and dry grassland types and short emergent meadow types maintained by man-made dams. Vegetation consists of a mixture of grasses, perennial herbs, rushes, and sedges. Woody vegetation is typically associated with riparian meadows. Riparian vegetation can be shrub or tree form, such as willow, alder, cottonwood, and aspen types. Meadow types are coded as wet or dry, with or without woody vegetation, or short emergent wetland. Meadow polygons are mapped to a minimum of 5 acres. California Vegetation (CALVEG) types within a meadow polygon are mapped to a minimum of 2.5 acres.

This dataset is a compilation of forest insect, disease and abiotic damage mapped by aerial detection surveys on forested areas in the United States. At this time, the National Aerial Survey Data Standards require only mortality and defoliation data be collected and reported. However, many cooperators collect data on other types of damage and therefore, the national database has been designed to accommodate these data. Low-level flights, typically 1,000 to 2,000 feet above ground level, are used to map forest damage. Observers use paper maps, typically 1:100,000 scale USGS maps, upon which they record the damage. There is also a digital sketchmap system that may be used. The digital system uses GPS to display the...

The acquisition of host species distributions is a significant factor in the identification of areas at risk of mortality to a particular agent. The most readily-available forest type maps do not contain enough location-specific information for insect and disease risk assessments, in particular species' age and stocking. Estimates for total and individual species' basal area (BA), quadratic mean diameter (QMD), stand density index (SDI), percent host composition, and predominant canopy position were developed for all 57 tree species and species groups modeled for the National Insect and Disease Risk Map. After extensively testing various interpolation methods, the Risk Map Integration Team (RMIT) utilized a...
This is part of a 3-tiered dataset consisting ofIDS_shapes: footprint polygon featuresIDS_attrib: attribute descriptions of polygonsIDS_rollup: lookup information for features that are summarized as a group (rollup)This dataset is a compilation of forest insect, disease and abiotic damage mapped by aerial detection surveys on forested areas in the United States. At this time, the National Aerial Survey Data Standards require only mortality and defoliation data be collected and reported. However, many cooperators collect data on other types of damage and therefore, the national database has been designed to accommodate these data. Low-level flights, typically 1,000 to 2,000 feet above ground level, are used to map...

This map layer shows Indian lands of the United States. For the most part, only areas of 320 acres or more are included; some smaller areas deemed to be important or significant are also included. Federally-administered lands within a reservation are included for continuity; these may or may not be considered part of the reservation and are simply described with their feature type and the administrating Federal agency. Some established Indian lands which are larger than 320 acres are not included in this map layer because their boundaries were not available from the owning or administering agency.
This dataset depicts the land allocations created by the Northwest Forest Plan Record of Decision (NwFP). It includes land allocations identified in the Northwest Forest Plan. This is an interagency product and should be regarded as the main dataset for these land allocations. The Northwest Forest Plan encompasses 24 million acres of federal land managed by the Forest Service, Bureau of Land Management, and National Park Service in western Washington, Oregon, and northwest California within the range of the northern spotted owl. The Plan's objectives are threefold: * Protecting and enhancing habitat for mature and old-growth forests and related species. * Restoring and maintaining the ecological integrity of watersheds...

Since 1999, the B.C. Ministry of Forests has surveyed the majority of the forested land in the province using the classic sketch mapping technique known as the the overview survey method. The purpose of the survey is to record and report the general trends in disturbance patterns across the provincial forested land base (including provincial parks, private land, and Tree Farm Licences but not Federal parks). The survey has been a key source of data documenting the development of the current mountain pine beetle outbreak in the interior of B.C. Data from the BC MOF survey is also comparable to data collected from 1914 to 1995 by the Canadian Forest Service's former Forest Insect and Disease Survey Unit (FIDS)...

The 2006 National Insect and Disease Risk Map (NIDRM) Project integrates 188 individual risk models constructed within a common, consistent framework that accounts for regional variations in current and future forest health. The 2006 risk assessment, conducted within the contiguous United States and Alaska, provides a consistent, repeatable, transparent process through which interactive spatial and temporal risk assessments can be conducted at various scales to aid in the allocation of resources for forest health management. This modeling process is intended to increase the utilization of forest health risk maps within and outside the National Forest System and encourage development of future risk maps. NIDRM...

This dataset depicts land use zones on National Forests in Southern California, for the purpose of identifying appropriate management types of 'uses' that are consistent with the achievement of the desired conditions described in Part 1 of the revised forest plan. These land use zones are used to help demonstrate clearly management's intent and to indicate the anticipated level of public land use in any area (Place) of the national forest.
This dataset is a union of seven datasets created by the Merriam-Powell Center for Environmental Research (MPCER) at Northern Arizona University using data from a a United States Forest Service (USFS) aerial mapping project. The dataset was modified by selecting individual species from the USFS data. The original USFS dataset is a compilation of forest insect, disease and abiotic damage mapped by aerial detection surveys on forested areas in the United States. At this time, the National Aerial Survey Data Standards require only mortality and defoliation data be collected and reported. However, many cooperators collect data on other types of damage and therefore, the national database has been designed to accommodate...

This dataset depicts Critical Aquatic Refuges (CARs) found in the Sierra Nevada National Forests. CARs are subwatersheds, generally ranging between 10,000 to 40,000 acres, with some as small 500 acres and some as large as 100,000 acres, that contain either: * known locations of threatened, endangered, or sensitive species, * highly vulnerable populations of native plant or animal species, or * localized populations of rare native aquatic- or riparian-dependent plant or animal species. The primary role of CARs is to preserve, enhance, restore or connect habitats for these species at the local level and to ensure the viability of aquatic or riparian dependent species. In many cases, CARs support the best remaining...

The 2006 National Insect and Disease Risk Map (NIDRM) Project integrates 188 individual risk models constructed within a common, consistent framework that accounts for regional variations in current and future forest health. The 2006 risk assessment, conducted within the contiguous United States and Alaska, provides a consistent, repeatable, transparent process through which interactive spatial and temporal risk assessments can be conducted at various scales to aid in the allocation of resources for forest health management. This modeling process is intended to increase the utilization of forest health risk maps within and outside the National Forest System and encourage development of future risk maps. The key...

This dataset is a compilation of forest insect, disease and abiotic damage mapped by aerial detection surveys on forested areas in the United States. At this time, the National Aerial Survey Data Standards require only mortality and defoliation data be collected and reported. However, many cooperators collect data on other types of damage and therefore, the national database has been designed to accommodate these data. Low-level flights, typically 1,000 to 2,000 feet above ground level, are used to map forest damage. Observers use paper maps, typically 1:100,000 scale USGS maps, upon which they record the damage. There is also a digital sketchmap system that may be used. The digital system uses GPS to display the...
The 2006 National Insect and Disease Risk Map (NIDRM) Project integrates 188 individual risk models constructed within a common, consistent framework that accounts for regional variations in current and future forest health. The 2006 risk assessment, conducted within the contiguous United States and Alaska, provides a consistent, repeatable, transparent process through which interactive spatial and temporal risk assessments can be conducted at various scales to aid in the allocation of resources for forest health management. This modeling process is intended to increase the utilization of forest health risk maps within and outside the National Forest System and encourage development of future risk maps. NIDRM...

This dataset is a compilation of forest insect, disease and abiotic damage mapped by aerial detection surveys on forested areas in the United States. At this time, the National Aerial Survey Data Standards require only mortality and defoliation data be collected and reported. However, many cooperators collect data on other types of damage and therefore, the national database has been designed to accommodate these data. Low-level flights, typically 1,000 to 2,000 feet above ground level, are used to map forest damage. Observers use paper maps, typically 1:100,000 scale USGS maps, upon which they record the damage. There is also a digital sketchmap system that may be used. The digital system uses GPS to display the...
|

|
