Filters: Tags: Nitrogen (X)
348 results (286ms)|
Filters
Date Range
Extensions
Types
Contacts
Categories
Tag Types
|
Nitrogen, phosphorus, and suspended-sediment loads, and changes in loads, in major rivers across the Chesapeake Bay watershed have been calculated using monitoring data from the Chesapeake Bay River Input Monitoring (RIM) stations for the period 1985 through 2019. Nutrient and suspended-sediment loads and changes in loads were determined by applying a weighted regression approach called WRTDS (Weighted Regression on Time, Discharge, and Season). The load results represent the total mass of nitrogen, phosphorus, and suspended sediment that was exported from each of the RIM watersheds. To determine the trend in loads, the annual load results are flow normalized to integrate out the year-to-year variability in river...
Types: Map Service,
OGC WFS Layer,
OGC WMS Layer,
OGC WMS Service;
Tags: Chesapeake Bay Watershed,
Delaware,
Maryland,
New York,
Pennsylvania,
This data release consists of the data used to develop SPAtially Referenced Regression On Watershed(SPARROW) attributes models for estimating loads of total phosphorus and total nitrogen in Tennessee streams. These data support the publication containing the Tennessee SPARROW models results (Hoos and others, 2019) and include model input used in the South Atlantic-Gulf Drainages and Tennessee River Basin (SAGT) nutrient SPARROW models (Hoos and McMahon, 2009; Garcia and others, 2011) as well as model input for river basins in Tennessee not included in the domain of the published SAGT SPARROW models. Also included in this data release are model coefficients, the software required to execute the Tennessee SPARROW...
The data include measurements of chlorophyll a and algal stoichiometry from benthic algae collected from Sky Pond, Rocky Mountain National Park, Colorado, in 2015-2017; results of nutrient diffusion experiments in Sky Pond including chlorophyll a and other pigments to identify chlorophytes, bacillariophytes, and myxomycetes, and results of a laboratory incubation using benthic chlorophytes to identify ecosystem responses (nitrogen uptake, net primary productivity, ecosystem respiration, net ecosystem productivity, and dissolved organic carbon production) under nutrient and temperature treatments.
Categories: Data;
Tags: Colorado,
Rocky Mountain,
Rocky Mountain National Park,
USGS Science Data Catalog (SDC),
algae,
Nitrogen, phosphorus, and suspended-sediment loads, and changes in loads, in rivers across the Chesapeake Bay watershed have been calculated using monitoring data from the Chesapeake Bay Nontidal Network (NTN) stations for the period 1985 through 2018. Nutrient and suspended-sediment loads and changes in loads were determined by applying a weighted regression approach called WRTDS (Weighted Regression on Time, Discharge, and Season). The load results represent the total mass of nitrogen, phosphorus, and suspended sediment that was exported from each of the NTN watersheds. To determine the trend in loads, the annual load results are flow normalized to integrate out the year-to-year variability in river discharge....
Categories: Data;
Types: Map Service,
OGC WFS Layer,
OGC WMS Layer,
OGC WMS Service;
Tags: Chesapeake Bay Watershed,
Delaware,
Maryland,
New York,
Pennsylvania,
Nitrogen, phosphorus, and suspended-sediment loads, and changes in loads, in rivers across the Chesapeake Bay watershed have been calculated using monitoring data from the Chesapeake Bay Nontidal Network (NTN) stations for the period 1985 through 2018 Nutrient and suspended-sediment loads and changes in loads were determined by applying a weighted regression approach called WRTDS (Weighted Regression on Time, Discharge, and Season). The load results represent the total mass of nitrogen, phosphorus, and suspended sediment that was exported from each of the NTN watersheds. The file containing monthly loads for all applicable NTN monitoring stations is provided in the "Attached Files" section. First posted: February...
Categories: Data;
Types: Map Service,
OGC WFS Layer,
OGC WMS Layer,
OGC WMS Service;
Tags: Chesapeake Bay Watershed,
Delaware,
Maryland,
New York,
Pennsylvania,
Nitrogen, phosphorus, and suspended-sediment loads, and changes in loads, in rivers across the Chesapeake Bay watershed have been calculated using monitoring data from the Chesapeake Bay Nontidal Network (NTN) stations for the period 1985 through 2018. Nutrient and suspended-sediment loads and changes in loads were determined by applying a weighted regression approach called WRTDS (Weighted Regression on Time, Discharge, and Season). The load results represent the total mass of nitrogen, phosphorus, and suspended sediment that was exported from each of the NTN watersheds. The files containing all inputs required to run WRTDS for all applicable NTN monitoring stations are provided in the "Attached Files" section.
Categories: Data;
Types: Map Service,
OGC WFS Layer,
OGC WMS Layer,
OGC WMS Service;
Tags: Chesapeake Bay Watershed,
Delaware,
Maryland,
New York,
Pennsylvania,
Nitrogen, phosphorus, and suspended-sediment loads, and changes in loads, in major rivers across the Chesapeake Bay watershed have been calculated using monitoring data from the Chesapeake Bay River Input Monitoring (RIM) Network stations for the period 1985 through 2020. Nutrient and suspended-sediment loads and changes in loads were determined by applying a weighted regression approach called WRTDS (Weighted Regression on Time, Discharge, and Season). The load results represent the total mass of nitrogen, phosphorus, and suspended sediment that was exported from each of the RIM watersheds.
Categories: Data;
Types: Map Service,
OGC WFS Layer,
OGC WMS Layer,
OGC WMS Service;
Tags: Chesapeake Bay Watershed,
Delaware,
Kalman filtering,
Maryland,
New York,
This metadata record documents 3 sets of comma delimited tables representing the amount of reported best management practice (BMP) implementation within the Chesapeake Bay watershed as well as output data from scenarios of the Chesapeake Bay Program Phase 5.3.2 Watershed Model. The scenario data were used to estimate the effects of BMPs on water quality. The data are organized by three themes (child items below); 1) BMP implementation and definitions, 2) isolation scenarios, and 3) "Progress" and "No Action" scenarios.
Here we archive data collected during a nitrogen addition field experiment in the Sacramento River Deep Water Ship Channel. Calcium nitrate was added on 8 dates to a segment of the ship channel centered at Navigation Light 74. Prior to and following the nutrient additions, we collected water samples and sensor-based measurements at 7 sites between Navigation Light 70 and 76. Water samples for nutrient analyses were collected in 500 mL High Density Poly Ethylene (HDPE) amber containers from 1 m and 8 m depths using a peristaltic pump. Whole water samples for phytoplankton analysis were collected from 1 m depth in 500 mL clear HDPE containers and immediately preserved with 20 mL of Lugol’s iodine solution (Lugol’s,...
Categories: Data;
Tags: Sacramento River,
Sacramento River Deep Water Ship Channel,
Sacramento–San Joaquin Delta,
Temperature,
West Sacramento,
The San Juan Bay Estuary, Puerto Rico, contains mangrove forests that store significant amounts of organic carbon in soils and biomass. There is a strong urbanization gradient across the estuary, from the highly urbanized and clogged Caño Martin Peña in the western part of the estuary, a series of lagoons in the center of the estuary, and a tropical forest reserve (Piñones) in the easternmost part with limited urbanization. We collected sediment cores to determine carbon burial rates and vertical sediment accretion from five sites in the San Juan Bay Estuary. Cores were radiometrically-dated using lead-210 and the Plum age model. Sites had soil C burial rates ranging from 50 grams per meter squared per year (g m-2...
Categories: Data;
Types: Map Service,
OGC WFS Layer,
OGC WMS Layer,
OGC WMS Service;
Tags: 137-cesium,
210-lead,
Caño de Martín Peña (1613013),
Commonwealth of Puerto Rico (1779808),
Geochemistry,
These data were collected as part of a study headwater streams of the lowland Brazilian Amazon to assess the effects of land use change on organic matter dynamics (OM), ecosystem metabolism, and nutrient concentrations and uptake (nitrate and phosphate) in 11 first order streams draining forested (n=4) or cropland (n=7) water-sheds with intact riparian forests. Data included here are from 10 streams, were collected from 2015-2018, and are associated with the publication “Land use change influences ecosystem function of headwater streams of the lowland Amazon Basin”. The full dataset is comprised of five individual datasets: land cover and physical characteristics of all streams included in the study; monthly terrestrial...
This product provides tabular estimates of kilograms of nitrogen and phosphorus from a) fertilizer, and b) manure, for counties in the conterminous United States for the period 1950-2017. Data are generated for approximate five-year periods over the time, coinciding with U.S. Department of Agriculture Census of Agriculture census years. This data release also includes a model archive suitable for recreating the 2017 fertilizer estimates.
Nitrogen deposition is altering forest dynamics, terrestrial carbon storage, and biodiversity. However, our ability to forecast how different tree species will respond to N deposition, especially key response thresholds, is limited by a lack of synthesis across spatial scales and research approaches. To develop our best understanding of N deposition impact on tree growth and survival, we will integrate plot-‐ level studies describing plant growth and survival responses to N inputs and plant-‐ available soil nutrients with a continental scale analysis across a N deposition gradient. Our primary outcome will be estimates of tree response to N deposition with explicit representation of uncertainty and the identification...
The tundra biome is the dominant terrestrial ecosystem of the circumpolar north, and its fate in a rapidly changing climate is of high scientific and socioeconomic concern. One of those concerns is that the majority of caribou herds throughout the circumpolar north are declining, perhaps as a result of climate change. The principal objective of this research is to reveal the connections between soil nutrient cycling, forage quality and caribou habitat selection. This framework is underpinned by the concept that tundra ecosystem productivity is ultimately driven by the thermodynamics of the system induced by climate.
Categories: Data,
Publication;
Types: Citation;
Tags: ALPINE/TUNDRA,
ALPINE/TUNDRA,
CARBON,
CARBON,
CARBON CYCLE/CARBON BUDGET MODELS,

These data were released prior to the October 1, 2016 effective date for the USGS’s policy dictating the review, approval, and release of scientific data as referenced in USGS Survey Manual Chapter 502.8 Fundamental Science Practices: Review and Approval of Scientific Data for Release. This spatial data set was created by the U.S. Geological Survey (USGS) to represent the amount of dry deposition of reduced nitrogen in the Pacific Northwest region of the United States (Hydro Region 17; Major River Basin 7 (MRB7)) during 2002.
These data were released prior to the October 1, 2016 effective date for the USGS’s policy dictating the review, approval, and release of scientific data as referenced in USGS Survey Manual Chapter 502.8 Fundamental Science Practices: Review and Approval of Scientific Data for Release. This map shows specific water-quality items and hydrologic data site information which come from QWDATA (Water Quality) and GWSI (Ground Water Information System). Both QWDATA and GWSI are subsystems of NWIS (National Water Inventory System)of the USGS (United States Geologic Survey). This map is for Wayne County, Utah. The scope and purpose of NWIS is defined on the web site: http://water.usgs.gov/public/pubs/FS/FS-027-98/
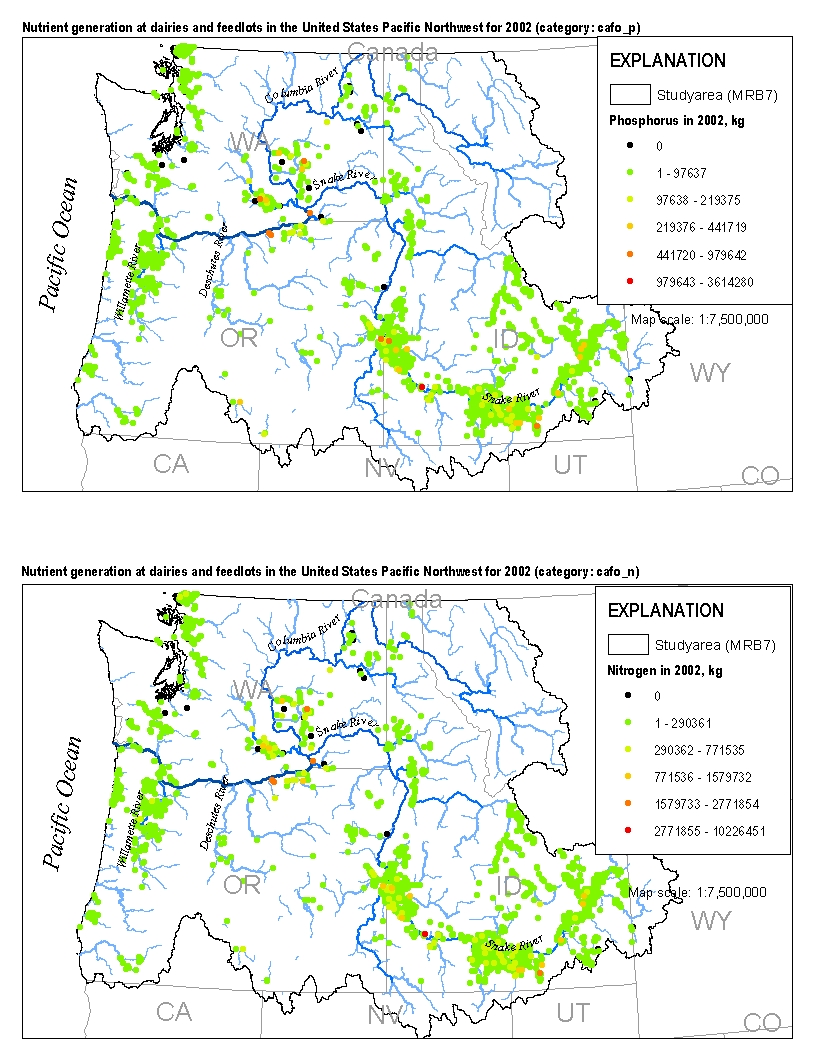
This spatial data set was created by the U.S. Geological Survey (USGS) to represent the amount of nitrogen and phosphorus generated by cattle at dairies and feedlots in the Pacific Northwest region of the United States (Hydro Region 17; Major River Basin 7 (MRB7)) during 2002.
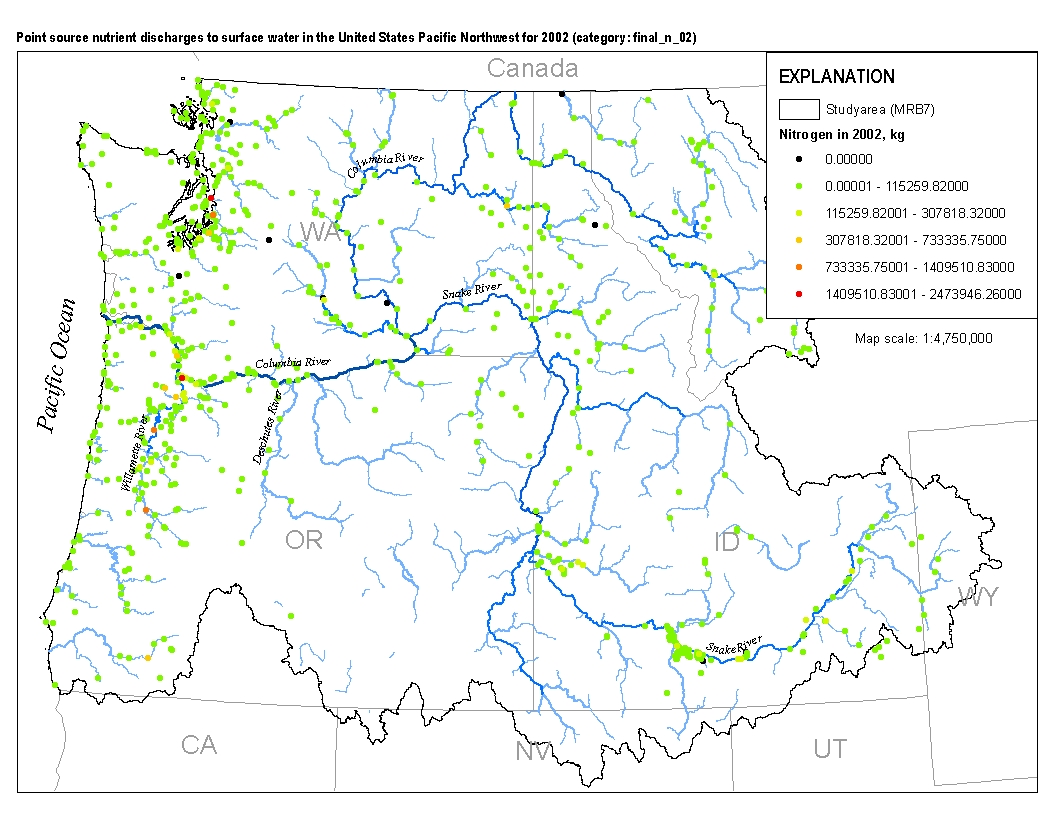
This spatial data set was created by the U.S. Geological Survey (USGS) to represent the amount of total nitrogen and total phosphorus discharged to surface waters in the Pacific Northwest region of the United States (Hydro Region 17; Major River Basin 7 (MRB7)) during 2002 from individual permitted wastewater facilities.
These data show the results of for Nitrate monitoring in Florida Springs for 2018. Water Quality in Florida Springs is an ecological indicator for the Landscape Conservation Project for Florida. The project entails large-scale assessment of and planning for the health of important natural resources in Florida, known as Conservation Assets (CAs). Conservation planning at the landscape scale provides a framework for safeguarding functional ecosystems, and their interconnected processes necessary to achieve true preservation of healthy resources. Spatially explicit data from the project informs prioritization and coordination for conservation decision-making. A suite of ecological indicators was carefully selected...
Categories: Data;
Types: ArcGIS REST Map Service,
ArcGIS Service Definition,
Downloadable,
Map Service;
Tags: Florida,
Landscape Conservation,
Nitrogen,
Springs,
Water Quality
|

|
