Filters: Tags: North America (X) > partyWithName: Conservation Biology Institute (X)
485 results (48ms)|
Filters
Date Range
Types Contacts Categories Tag Schemes |
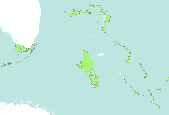
These maps are a digital representation of the individual tree species range maps of the Atlas of the United States Trees by Elbert L. Little, Jr. The atlas shows the natural distribution or range of the native tree species of North America. These coverages represent 3 volumes of the atlas. Little's tree extent maps can be found in the Data Basin gallery here: http://app.databasin.org/app/pages/galleryPage.jsp?id=5e449f3c91304f498a96299a9d5460a3
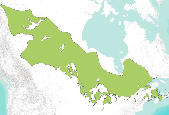
These maps are a digital representation of the individual tree species range maps of the Atlas of the United States Trees by Elbert L. Little, Jr. The atlas shows the natural distribution or range of the native tree species of North America. These coverages represent 3 volumes of the atlas. Little's tree extent maps can be found in the Data Basin gallery here: http://app.databasin.org/app/pages/galleryPage.jsp?id=5e449f3c91304f498a96299a9d5460a3

These maps are a digital representation of the individual tree species range maps of the Atlas of the United States Trees by Elbert L. Little, Jr. The atlas shows the natural distribution or range of the native tree species of North America. These coverages represent 3 volumes of the atlas. Little's tree extent maps can be found in the Data Basin gallery here: http://app.databasin.org/app/pages/galleryPage.jsp?id=5e449f3c91304f498a96299a9d5460a3

MC1 is a dynamic vegetation model for estimating the distribution of vegetation and associated ecosystem fluxes of carbon, nutrients, and water. It was created to assess the potential impacts of global climate change on ecosystem structure and function at a wide range of spatial scales from landscape to global. The model incorporates transient dynamics to make predictions about the patterns of ecological change. MC1 was created by combining physiologically based biogeographic rules defined in the MAPSS model with a modified version of the biogeochemical model, CENTURY. MC1 includes a fire module, MCFIRE, that mechanistically simulates the occurrence and impacts of fire events. Climate input data sources for this...

These maps are a digital representation of the individual tree species range maps of the Atlas of the United States Trees by Elbert L. Little, Jr. The atlas shows the natural distribution or range of the native tree species of North America. These coverages represent 3 volumes of the atlas. Little's tree extent maps can be found in the Data Basin gallery here: http://app.databasin.org/app/pages/galleryPage.jsp?id=5e449f3c91304f498a96299a9d5460a3

Winter (January – March) precipitation averaged over 2046-2065 from the general circulation model PCM1 (Washington et al. 2000; Meehl et al. 2003) under the A2 emission scenario with a grid cell size of 10 km x 10km. References: Meehl, G.A., W.M. Washington, T.M.L. Wigley, J.M. Arblaster, and A. Dai. 2003. Solar and greenhouse gas forcing and climate response in the twentieth century. J Climate 16:426–444. Washington, W.M., J.W. Weatherly, G.A. Meehl, A.J. Semtner, T.W. Bettge, A.P. Craig, W.G. Stran, J. Arblaster, V.B. Wayland, R. James , and Y. Zhang. 2000. Parallel climate model (PCM) control and transient simulations. Clim Dyn 16: 755–774.

Winter (January – March) precipitation (mm) averaged over 2046-2065 from the general circulation model Hadley CM3 (Gordon et al. 2000, Pope et al. 2000) downscaled to a grid cell size of 10 km x 10km. References: Gordon C., C. Cooper , C.A. Senior, H. Banks, J.M. Gregory, T.C. Johns , J.F.B. Mitchell, and R.A. Wood. 2000. The simulation of SST, sea ice extents and ocean heat transports in a version of the Hadley Centre coupled model without flux adjustments. Clim Dyn 16:147–168. Pope, V.D., M.L. Gallani, P.R. Rowntree, and R.A. Stratton. 2000. The impact of new physical parameterisations in the Hadley Centre climate model – HadAM3. Clim Dyn 16:123–146.

Future (2046-2065) predicted probability of fisher year-round occurrence projected under the A1fi emissions scenario with the Hadley CM3 GCM model (Gordon et al. 2000, Pope et al. 2000). Projected fisher distribution was created with Maxent (Phillips et al. 2006) using fisher detections (N = 102, spanning 1993 – 2011) and seven predictor variables: mean winter (January – March) precipitation, mean summer (July – September) precipitation, mean summer temperature amplitude, mean daily low temperature for the month of the year with the warmest mean daily low temperature, mean fraction of vegetation carbon burned, mean vegetation carbon (g C m2), and modal vegetation class. Predictor variables had a grid cell size of...
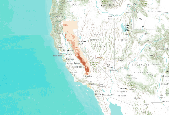
Description: Predicted probability of fisher year-round occurrence created with Maxent (Phillips et al. 2006) using fisher detections (N = 102, spanning 1993 – 2011) and seven predictor variables: mean winter (January – March) precipitation, mean summer (July – September) precipitation, mean summer temperature amplitude, mean daily low temperature for the month of the year with the warmest mean daily low temperature, mean fraction of vegetation carbon burned, mean vegetation carbon (g C m2), and modal vegetation class. Predictor variables had a grid cell size of 10 km, vegetation variables were simulated with MC1 (Hayhoe et al. 2004) and climate variables were provided by the PRISM GROUP (Daly et al. 1994). This...

Annual precipitation (mm) averaged over 1986 – 2005, simulated by the MC1 dynamic global vegetation model (Bachelet et al. 2001) at a 4 km x 4 km spatial resolution using PRISM climate for the historical period. This effort is part of a pilot project to apply and evaluate the Yale Framework (Yale Science Panel for Integrating Climate Adaptation and Landscape Conservation Planning). Note: The MC1 model is described in data basin (http://databasin.org/climate-center/features/mc1-dynamic-global-vegetation-model).

Simulated fraction of vegetation carbon in forest averaged over 2076-2095 simulated by the MC1 dynamic global vegetation model (Bachelet et al. 2001) at a 800 m x 800 m spatial resolution using future climate projections provided through CMIP3 (http://www-pcmdi.llnl.gov/ipcc/about_ipcc.php). Future climate drivers were generated using statistical downscaling (simple delta method) of general circulation model projections, in this case Hadley CM3 (Johns et al. 2003) under the A2 emission scenario (Naki?enovi? et al. 2000). The deltas (differences for temperatures and ratios for precipitation) were used to modify PRISM 800 m historical baseline (Daly et al. 2008). Note: The MC1 model is described in data basin...

Simulated fraction of vegetation carbon in forest averaged over 2046-2065 simulated by the MC1 dynamic global vegetation model (Bachelet et al. 2001) at a 800 m x 800 m spatial resolution using future climate projections provided through CMIP3 (http://www-pcmdi.llnl.gov/ipcc/about_ipcc.php). Future climate drivers were generated using statistical downscaling (simple delta method) of general circulation model projections, in this case CSIRO Mk3 A2 (Gordon 2002) under the A2 emission scenario (Naki?enovi? et al. 2000). The deltas (differences for temperatures and ratios for precipitation) were used to modify PRISM 800 m historical baseline (Daly et al. 2008). Note: The MC1 model is described in data basin (http://databasin.org/climate-center/features/mc1-dynamic-global-vegetati...

NARCCAP: http://www.narccap.ucar.edu/ The North American Regional Climate Change Assessment Program (NARCCAP) is an international program that will serve the climate scenario needs of the United States, Canada, and northern Mexico. NARCCAP is systematically investigating the uncertainties in future climate projections on the regional level. NARCCAP closely matches the regional climate models (RCMs) with multiple atmosphere-ocean general circulation models (AOGCMs) along with the A2 scenario from the Special Report on Emission Scenarios (SRES) over an area covering most of North America. NARCCAP also validates the regional climate model performance by driving the RCMs with reanalyses, which is similar to driving...

NARCCAP: http://www.narccap.ucar.edu/ The North American Regional Climate Change Assessment Program (NARCCAP) is an international program that will serve the climate scenario needs of the United States, Canada, and northern Mexico. NARCCAP is systematically investigating the uncertainties in future climate projections on the regional level. NARCCAP closely matches the regional climate models (RCMs) with multiple atmosphere-ocean general circulation models (AOGCMs) along with the A2 scenario from the Special Report on Emission Scenarios (SRES) over an area covering most of North America. NARCCAP also validates the regional climate model performance by driving the RCMs with reanalyses, which is similar to driving...

NARCCAP: http://www.narccap.ucar.edu/ The North American Regional Climate Change Assessment Program (NARCCAP) is an international program that will serve the climate scenario needs of the United States, Canada, and northern Mexico. NARCCAP is systematically investigating the uncertainties in future climate projections on the regional level. NARCCAP closely matches the regional climate models (RCMs) with multiple atmosphere-ocean general circulation models (AOGCMs) along with the A2 scenario from the Special Report on Emission Scenarios (SRES) over an area covering most of North America. NARCCAP also validates the regional climate model performance by driving the RCMs with reanalyses, which is similar to driving...

NARCCAP: http://www.narccap.ucar.edu/ The North American Regional Climate Change Assessment Program (NARCCAP) is an international program that will serve the climate scenario needs of the United States, Canada, and northern Mexico. NARCCAP is systematically investigating the uncertainties in future climate projections on the regional level. NARCCAP closely matches the regional climate models (RCMs) with multiple atmosphere-ocean general circulation models (AOGCMs) along with the A2 scenario from the Special Report on Emission Scenarios (SRES) over an area covering most of North America. NARCCAP also validates the regional climate model performance by driving the RCMs with reanalyses, which is similar to driving...

NARCCAP: http://www.narccap.ucar.edu/ The North American Regional Climate Change Assessment Program (NARCCAP) is an international program that will serve the climate scenario needs of the United States, Canada, and northern Mexico. NARCCAP is systematically investigating the uncertainties in future climate projections on the regional level. NARCCAP closely matches the regional climate models (RCMs) with multiple atmosphere-ocean general circulation models (AOGCMs) along with the A2 scenario from the Special Report on Emission Scenarios (SRES) over an area covering most of North America. NARCCAP also validates the regional climate model performance by driving the RCMs with reanalyses, which is similar to driving...

NARCCAP: http://www.narccap.ucar.edu/ The North American Regional Climate Change Assessment Program (NARCCAP) is an international program that will serve the climate scenario needs of the United States, Canada, and northern Mexico. NARCCAP is systematically investigating the uncertainties in future climate projections on the regional level. NARCCAP closely matches the regional climate models (RCMs) with multiple atmosphere-ocean general circulation models (AOGCMs) along with the A2 scenario from the Special Report on Emission Scenarios (SRES) over an area covering most of North America. NARCCAP also validates the regional climate model performance by driving the RCMs with reanalyses, which is similar to driving...

NARCCAP: http://www.narccap.ucar.edu/ The North American Regional Climate Change Assessment Program (NARCCAP) is an international program that will serve the climate scenario needs of the United States, Canada, and northern Mexico. NARCCAP is systematically investigating the uncertainties in future climate projections on the regional level. NARCCAP closely matches the regional climate models (RCMs) with multiple atmosphere-ocean general circulation models (AOGCMs) along with the A2 scenario from the Special Report on Emission Scenarios (SRES) over an area covering most of North America. NARCCAP also validates the regional climate model performance by driving the RCMs with reanalyses, which is similar to driving...

MC1 is a dynamic vegetation model for estimating the distribution of vegetation and associated ecosystem fluxes of carbon, nutrients, and water. It was created to assess the potential impacts of global climate change on ecosystem structure and function at a wide range of spatial scales from landscape to global. The model incorporates transient dynamics to make predictions about the patterns of ecological change. MC1 was created by combining physiologically based biogeographic rules defined in the MAPSS model with a modified version of the biogeochemical model, CENTURY. MC1 includes a fire module, MCFIRE, that mechanistically simulates the occurrence and impacts of fire events. Climate input data sources for this...
|

|
