Filters: Tags: Oklahoma (X)
11,359 results (38ms)|
Filters
Date Range
Extensions (Less)
Types (Less)
Contacts (Less)
Categories (Less)
Tag Types
|
USGS Topo Map Vector Data (Vector) 36870 Racine, Missouri 20210623 for 7.5 x 7.5 minute FileGDB 10.1
Layers of geospatial data include contours, boundaries, land cover, hydrography, roads, transportation, geographic names, structures, and other selected map features.
This data set contains imagery from the National Agriculture Imagery Program (NAIP). The NAIP program is administered by USDA FSA and has been established to support two main FSA strategic goals centered on agricultural production. These are, increase stewardship of America's natural resources while enhancing the environment, and to ensure commodities are procured and distributed effectively and efficiently to increase food security. The NAIP program supports these goals by acquiring and providing ortho imagery that has been collected during the agricultural growing season in the U.S. The NAIP ortho imagery is tailored to meet FSA requirements and is a fundamental tool used to support FSA farm and conservation programs....
This data set contains imagery from the National Agriculture Imagery Program (NAIP). The NAIP program is administered by USDA FSA and has been established to support two main FSA strategic goals centered on agricultural production. These are, increase stewardship of America's natural resources while enhancing the environment, and to ensure commodities are procured and distributed effectively and efficiently to increase food security. The NAIP program supports these goals by acquiring and providing ortho imagery that has been collected during the agricultural growing season in the U.S. The NAIP ortho imagery is tailored to meet FSA requirements and is a fundamental tool used to support FSA farm and conservation programs....
This data set contains imagery from the National Agriculture Imagery Program (NAIP). The NAIP program is administered by USDA FSA and has been established to support two main FSA strategic goals centered on agricultural production. These are, increase stewardship of America's natural resources while enhancing the environment, and to ensure commodities are procured and distributed effectively and efficiently to increase food security. The NAIP program supports these goals by acquiring and providing ortho imagery that has been collected during the agricultural growing season in the U.S. The NAIP ortho imagery is tailored to meet FSA requirements and is a fundamental tool used to support FSA farm and conservation programs....
This data set contains imagery from the National Agriculture Imagery Program (NAIP). The NAIP program is administered by USDA FSA and has been established to support two main FSA strategic goals centered on agricultural production. These are, increase stewardship of America's natural resources while enhancing the environment, and to ensure commodities are procured and distributed effectively and efficiently to increase food security. The NAIP program supports these goals by acquiring and providing ortho imagery that has been collected during the agricultural growing season in the U.S. The NAIP ortho imagery is tailored to meet FSA requirements and is a fundamental tool used to support FSA farm and conservation programs....
This data set contains imagery from the National Agriculture Imagery Program (NAIP). The NAIP program is administered by USDA FSA and has been established to support two main FSA strategic goals centered on agricultural production. These are, increase stewardship of America's natural resources while enhancing the environment, and to ensure commodities are procured and distributed effectively and efficiently to increase food security. The NAIP program supports these goals by acquiring and providing ortho imagery that has been collected during the agricultural growing season in the U.S. The NAIP ortho imagery is tailored to meet FSA requirements and is a fundamental tool used to support FSA farm and conservation programs....
This data set contains imagery from the National Agriculture Imagery Program (NAIP). The NAIP program is administered by USDA FSA and has been established to support two main FSA strategic goals centered on agricultural production. These are, increase stewardship of America's natural resources while enhancing the environment, and to ensure commodities are procured and distributed effectively and efficiently to increase food security. The NAIP program supports these goals by acquiring and providing ortho imagery that has been collected during the agricultural growing season in the U.S. The NAIP ortho imagery is tailored to meet FSA requirements and is a fundamental tool used to support FSA farm and conservation programs....
This data release component contains model inputs including river basin attributes, weather forcing data, and simulated and observed river discharge.
The U. S. Geological Survey (USGS) makes long-term seismic hazard forecasts that are used in building codes. The hazard models usually consider only natural seismicity; non-tectonic (man-made) earthquakes are excluded because they are transitory or too small. In the past decade, however, thousands of earthquakes related to underground fluid injection have occurred in the central and eastern U.S. (CEUS), and some have caused damage. In response, the USGS is now also making short-term forecasts that account for the hazard from these induced earthquakes. A uniform earthquake catalog is assembled by combining and winnowing pre-existing source catalogs. Seismicity statistics are analyzed to develop recurrence models,...
The database contains uniformly processed ground motion intensity measurements (peak horizontal ground motions and 5-percent-damped pseudospectral accelerations for oscillator periods 0.1–10 s). The earthquake event set includes more than 3,800 M≥3 earthquakes in Oklahoma and Kansas from January 2009 to December 2016. Ground motion time series were collected out to 500 km. We also relocated the majority of the earthquake hypocenters using a multiple-event relocation algorithm to produce a set of near-uniformly processed hypocentral locations. Details about data processing are reported in the accompanying article. First posted - October 11, 2017 Revised - December 18, 2017, ver. 1.1
Categories: Data,
Data Release - Revised;
Tags: EHP,
Earthquake Hazards Program,
GHSC,
Geologic Hazards Science Center,
Kansas,
Future climates are simulated by general circulation models (GCM) using climate change scenarios (IPCC 2014). To project climate change for the sagebrush biome, we used 11 GCMs and two climate change scenarios from the IPCC Fifth Assessment, representative concentration pathways (RCPs) 4.5 and 8.5 (Moss et al. 2010, Van Vuuren et al. 2011). RCP4.5 scenario represents a future where climate policies limit and achieve stabilization of greenhouse gas concentrations to 4.5 W m-2 by 2100. RCP8.5 scenario might be called a business-as-usual scenario, where high emissions of greenhouse gases continue in the absence of climate change policies. The two selected time frames allow comparison of near-term (2020-2050) and longer-term...
Categories: Data;
Types: Citation,
Downloadable,
GeoTIFF,
Map Service,
Raster;
Tags: Arizona,
CRS,
California,
Climate,
Colorado,
Layers of geospatial data include contours, boundaries, land cover, hydrography, roads, transportation, geographic names, structures, and other selected map features.
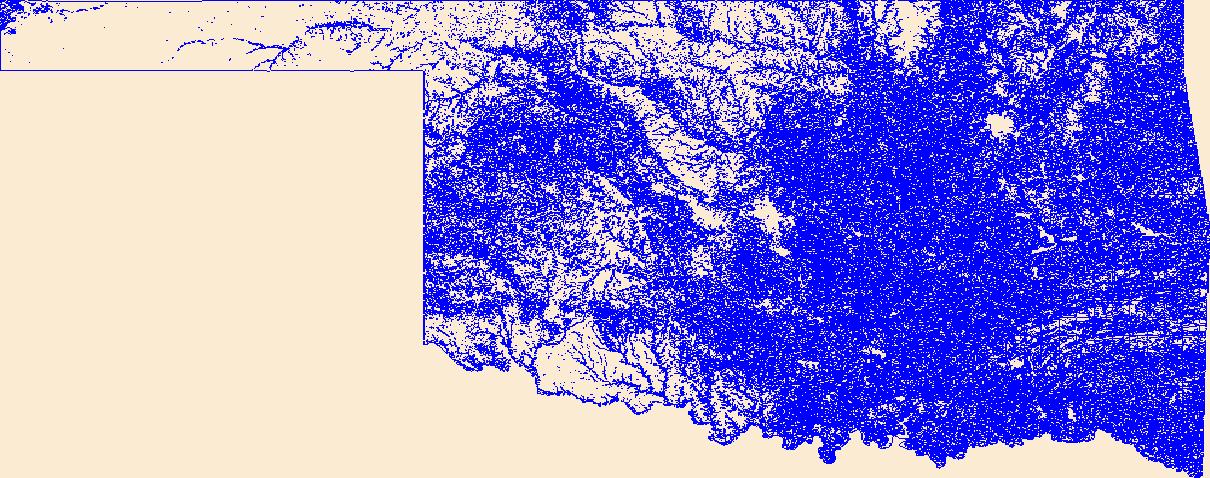
Geospatial data that is a derivative land cover product depicting woodland on topographic maps.
These data represent simulated soil temperature and moisture conditions for current climate, and for future climate represented by all available climate models at two time periods during the 21st century. These data were used to: 1) quantify the direction and magnitude of expected changes in several measures of soil temperature and soil moisture, including the key variables used to distinguish the regimes used in the R and R categories; 2) assess how these changes will impact the geographic distribution of soil temperature and moisture regimes; and 3) explore the implications for using R and R categories for estimating future ecosystem resilience and resistance.
This data set includes the relative production scenarios for eight (8) grass species based on linear models from Epstein, et al. (1998). We selected two indicator species for each community: shortgrass prairie: blue grama (Bouteloua gracilis; BOGR) and buffalo grass (Bouteloua dactyloides; BODA); mixedgrass prairie: sideoats grama (Bouteloua curtipendula; BOCU) and little bluestem (Schizachyrium scoparium; SCSC); tallgrass prairie: big bluestem (Andropogon gerardii; ANGE) and Indiangrass (Sorghastrum nutans; SONU); and semiarid grasslands: black grama (Bouteloua eriopoda; BOER) and tobosagrass (Pleuraphis mutica; PLMU). Soil texture (percent by weight) came from the Earth Systems Science Center (2008) which provided...

This map layer shows Indian lands of the United States. For the most part, only areas of 320 acres or more are included; some smaller areas deemed to be important or significant are also included. Federally-administered lands within a reservation are included for continuity; these may or may not be considered part of the reservation and are simply described with their feature type and the administrating Federal agency. Some established Indian lands which are larger than 320 acres are not included in this map layer because their boundaries were not available from the owning or administering agency.
The Critical Minerals in Archived Mine Samples Database (CMDB) contains chemistry and geologic information for historic ore and ore-related rock samples from mineral deposits in the United States. In addition, the database contains samples from archetypal deposits from 27 other countries in North America, South America, Asia, Africa and Europe. Samples were obtained from archived ore collections under the U.S. Geological Survey's project titled "Quick Assessment of Rare and Critical Metals in Ore Deposits: A National Assessment" (2008 to 2013) in an effort to begin an assessment of the Nations' previously mined ore deposits for critical minerals. Mineralized and altered rock samples were provided by the Colorado...
Categories: Data;
Types: ArcGIS REST Map Service,
ArcGIS Service Definition,
Downloadable,
Map Service,
OGC WFS Layer,
OGC WMS Layer,
Shapefile;
Tags: Alaska,
Argentina,
Arizona,
Arkansas,
Australia,
The U.S. Geological Survey (USGS) has developed and implemented an algorithm that identifies burned areas in dense time series of Landsat image stacks to produce the Landsat Burned Area Essential Climate Variable (BAECV) products. The algorithm makes use of predictors derived from individual Landsat scenes, lagged reference conditions, and change metrics between the scene and reference conditions. Outputs of the BAECV algorithm consist of pixel-level burn probabilities for each Landsat scene, and annual burn probability, burn classification, and burn date composites. These products were generated for the conterminous United States for 1984 through 2015. These data are also available for download at https://rmgsc.cr.usgs.gov/outgoing/baecv/BAECV_CONUS_v1.1_2017/...
|

|
