Filters: Tags: Oneida County (X)
307 results (169ms)|
Filters
Date Range
Extensions Types Contacts
Categories Tag Types
|
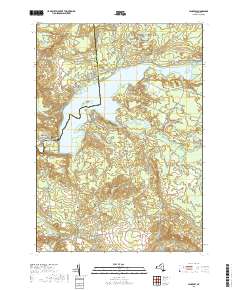
Layered geospatial PDF 7.5 Minute Quadrangle Map. Layers of geospatial data include orthoimagery, roads, grids, geographic names, elevation contours, hydrography, and other selected map features. This map is derived from GIS (geospatial information system) data. It represents a repackaging of GIS data in traditional map form, not creation of new information. The geospatial data in this map are from selected National Map data holdings and other government sources.
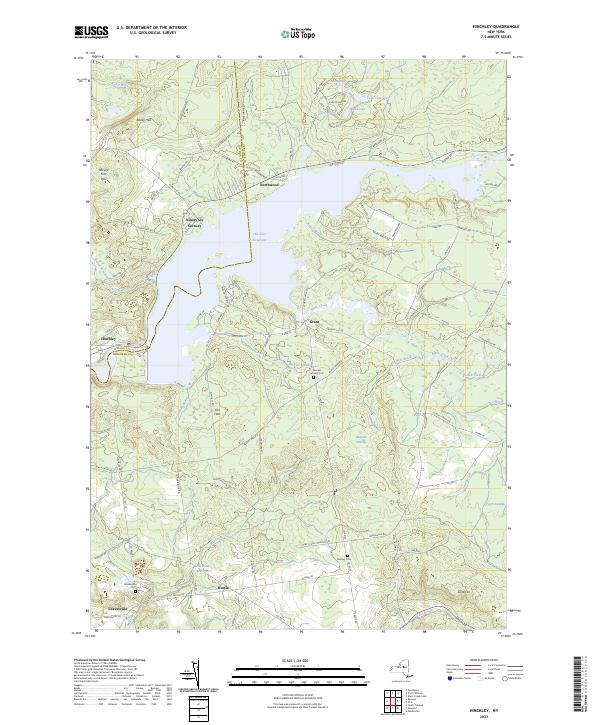
Layered geospatial PDF 7.5 Minute Quadrangle Map. Layers of geospatial data include orthoimagery, roads, grids, geographic names, elevation contours, hydrography, and other selected map features. This map is derived from GIS (geospatial information system) data. It represents a repackaging of GIS data in traditional map form, not creation of new information. The geospatial data in this map are from selected National Map data holdings and other government sources.
Layered geospatial PDF 7.5 Minute Quadrangle Map. Layers of geospatial data include orthoimagery, roads, grids, geographic names, elevation contours, hydrography, and other selected map features. This map is derived from GIS (geospatial information system) data. It represents a repackaging of GIS data in traditional map form, not creation of new information. The geospatial data in this map are from selected National Map data holdings and other government sources.
Layered geospatial PDF 7.5 Minute Quadrangle Map. Layers of geospatial data include orthoimagery, roads, grids, geographic names, elevation contours, hydrography, and other selected map features. This map is derived from GIS (geospatial information system) data. It represents a repackaging of GIS data in traditional map form, not creation of new information. The geospatial data in this map are from selected National Map data holdings and other government sources.
This child item dataset contains a shapefile of water velocity observations made by an Acoustic Doppler Current Profiler (ADCP) during the 2018 survey, and includes measurements of water speed and direction along longitudinal transects of the Old Erie Canal. This data release contains spatial datasets of bathymetry, water velocity, water quality, and infrastructure of a 30.8 mile reach of the Old Erie Canal between the Town of DeWitt and its junction with the current Erie Canal of the New York State Canal System in Verona, near Rome, New York during 2018 and 2019.
Categories: Data;
Types: Downloadable,
Map Service,
OGC WFS Layer,
OGC WMS Layer,
Shapefile;
Tags: ADCP,
GPS measurement,
Groundwater and Streamflow Information,
Madison County,
New York State,
This child item dataset contains a raster interpolated from bathymetry observation points collected during the 2018 survey. This data release contains spatial datasets of bathymetry, water velocity, water quality, and infrastructure of a 30.8 mile reach of the Old Erie Canal between the Town of DeWitt and its junction with the current Erie Canal of the New York State Canal System in Verona, near Rome, New York during 2018 and 2019.
Categories: Data;
Types: Downloadable,
GeoTIFF,
Map Service,
Raster;
Tags: ADCP,
Groundwater and Streamflow Information,
Madison County,
New York,
Old Erie Canal,
These vector contour lines are derived from the 3D Elevation Program using automated and semi-automated processes. They were created to support 1:24,000-scale CONUS and Hawaii, 1:25,000-scale Alaska, and 1:20,000-scale Puerto Rico / US Virgin Island topographic map products, but are also published in this GIS vector format. Contour intervals are assigned by 7.5-minute quadrangle, so this vector dataset is not visually seamless across quadrangle boundaries. The vector lines have elevation attributes (in feet above mean sea level on NAVD88), but this dataset does not carry line symbols or annotation.
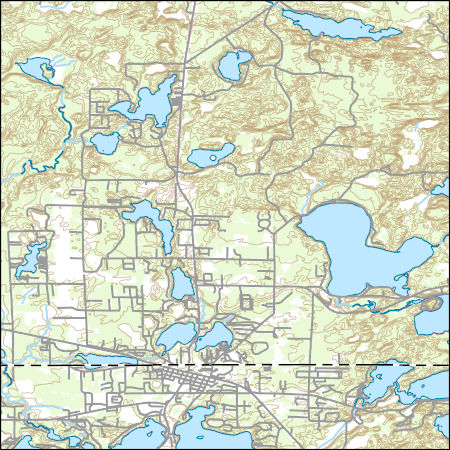
Layers of geospatial data include contours, boundaries, land cover, hydrography, roads, transportation, geographic names, structures, and other selected map features.
Types: Citation;
Tags: 7.5 x 7.5 minute,
7.5 x 7.5 minute,
Combined Vector,
Combined Vector,
Combined Vector,
From July through December 2016, 56 environmental samples were collected from the Mohawk and Western New York River Basins. Samples were collected from nine production wells and 13 domestic wells in the Mohawk River Basin, and 17 production wells and 17 domestic wells in the Western New York River Basins. Samples were collected and processed using standard USGS methods and analyzed for 320 constituents including physicochemical properties, dissolved gases, major ions, nutrients, trace elements, pesticides, volatile organic compounds, radionuclides, and indicator bacteria. Analytical methods are described and referenced in Gaige and others (2023). Five of the Mohawk River Basin wells (HE 622, HE 624, OE1468, SA1501,...
Categories: Data;
Types: Map Service,
OGC WFS Layer,
OGC WMS Layer,
OGC WMS Service;
Tags: Albany County,
Allegany County,
Ambient Monitoring,
Cattaraugus County,
Chautauqua County,
Layered geospatial PDF 7.5 Minute Quadrangle Map. Layers of geospatial data include orthoimagery, roads, grids, geographic names, elevation contours, hydrography, and other selected map features. This map is derived from GIS (geospatial information system) data. It represents a repackaging of GIS data in traditional map form, not creation of new information. The geospatial data in this map are from selected National Map data holdings and other government sources.
Layered geospatial PDF 7.5 Minute Quadrangle Map. Layers of geospatial data include orthoimagery, roads, grids, geographic names, elevation contours, hydrography, and other selected map features. This map is derived from GIS (geospatial information system) data. It represents a repackaging of GIS data in traditional map form, not creation of new information. The geospatial data in this map are from selected National Map data holdings and other government sources.
Layered geospatial PDF 7.5 Minute Quadrangle Map. Layers of geospatial data include orthoimagery, roads, grids, geographic names, elevation contours, hydrography, and other selected map features. This map is derived from GIS (geospatial information system) data. It represents a repackaging of GIS data in traditional map form, not creation of new information. The geospatial data in this map are from selected National Map data holdings and other government sources.
Layered geospatial PDF 7.5 Minute Quadrangle Map. Layers of geospatial data include orthoimagery, roads, grids, geographic names, elevation contours, hydrography, and other selected map features. This map is derived from GIS (geospatial information system) data. It represents a repackaging of GIS data in traditional map form, not creation of new information. The geospatial data in this map are from selected National Map data holdings and other government sources.
Layered geospatial PDF 7.5 Minute Quadrangle Map. Layers of geospatial data include orthoimagery, roads, grids, geographic names, elevation contours, hydrography, and other selected map features. This map is derived from GIS (geospatial information system) data. It represents a repackaging of GIS data in traditional map form, not creation of new information. The geospatial data in this map are from selected National Map data holdings and other government sources.
Layered geospatial PDF 7.5 Minute Quadrangle Map. Layers of geospatial data include orthoimagery, roads, grids, geographic names, elevation contours, hydrography, and other selected map features. This map is derived from GIS (geospatial information system) data. It represents a repackaging of GIS data in traditional map form, not creation of new information. The geospatial data in this map are from selected National Map data holdings and other government sources.
Layered geospatial PDF 7.5 Minute Quadrangle Map. Layers of geospatial data include orthoimagery, roads, grids, geographic names, elevation contours, hydrography, and other selected map features. This map is derived from GIS (geospatial information system) data. It represents a repackaging of GIS data in traditional map form, not creation of new information. The geospatial data in this map are from selected National Map data holdings and other government sources.

A MODFLOW-NWT model was used to simulate the water budget for Haskell Lake and Tower Creek in WI using the Lake, Streamflow Routing, and Unsaturated Zone Flow packages. Particle tracking was performed with the MODFLOW solution (using MODPATH 6). This USGS data release contains all of the input and output files for the simulations described in the associated model documentation report (https://doi.org/10.3133/sir20205024).

A MODFLOW-NWT groundwater flow model was developed to simulate groundwater movement in the area around Anvil Lake, and groundwater inputs and outputs from the lake from 1980 to 2014. Surface-water hydrology was simulated using the lake package. The MODFLOW model was first calibrated for steady-state conditions, or "average" conditions corresponding to January 1, 1980, to December 31, 2014 to estimate spatial hydrogeologic properties. Following the steady-state calibration, the model was applied in transient mode to estimate average monthly hydrologic conditions (groundwater inputs and outputs) for each year from 1980 to 2014.
This dataset supports the publication “Geophysical insights into Paleoproterozoic tectonics along the southern margin of the Superior Province, central Upper Peninsula, Michigan, USA.” At a 1:100,000 scale, these data are in a geologic database in the Geologic Map Schema (GeMS) which includes spatial feature classes and non-spatial tables that contain the geologic information presented in figure 8 and S3 of appendix A, the supplemental map of the publication. Geologic map of the central Upper Peninsula, Michigan
Categories: Data;
Types: Downloadable,
Map Service,
OGC WFS Layer,
OGC WMS Layer,
Shapefile;
Tags: Alger County,
Ashland County,
Baraga County,
Bayfield County,
Delta County,
Layered geospatial PDF 7.5 Minute Quadrangle Map. Layers of geospatial data include orthoimagery, roads, grids, geographic names, elevation contours, hydrography, and other selected map features. This map is derived from GIS (geospatial information system) data. It represents a repackaging of GIS data in traditional map form, not creation of new information. The geospatial data in this map are from selected National Map data holdings and other government sources.
|

|
