Filters: Tags: Orange County (X)
612 results (38ms)|
Filters
Date Range
Extensions (Less) Types (Less)
Contacts (Less)
Categories (Less) Tag Types
|
This U.S. Geological Survey (USGS) data release consists of daily evapotranspiration (ET) measurements/estimates for the time period January 29, 2009 to September 27, 2012. These data are derived from measurements of actual ET conducted at a height of 73 meters on the University of Central Florida WUCF 89.9 radio tower. The station is located at a nearly flat site (28 degrees 35 minutes 27 seconds North / 081 degrees 12 minutes 17 seconds West) within Orange County, Florida. The surrounding landscape is composed (2009 Land cover and land use, St. Johns River Water Management District – www.sjrwmd.com) of urban (61 percent), non-urban (34 percent) and water (5 percent) within an 8 kilometer radius of the radio tower....
Categories: Data;
Tags: Florida,
Orange County,
Orlando,
USGS Science Data Catalog (SDC),
University of Central Florida,
The dataset contains the environmental data collected for the Triangle Area Water Supply Monitoring Project. The data are from the samples collected during routine and storm-runoff sampling events during October 2013 through September 2015. Several study sites contained in this dataset were sampled for other USGS projects during the same time frame. Unless the samples at these sites were collected in conjunction with the Triangle Area Water Supply Monitoring Project, the data for other projects at these sites are not included in this dataset.
This U.S. Geological Survey (USGS) data release consists of 20-minute evapotranspiration (ET) measurements/estimates for the time period September 15, 1993 to August 27, 1994. These data are derived from measurements of actual ET conducted at a site within the Lake Wales Ridge, Florida characterized by sandy, rapidly-drained soils, and hilly topography. The station is located at a site (28 degrees 29 minutes 12 seconds North / 081 degrees 38 minutes 19 seconds West) within Orange County, Florida. The surrounding landscape is vegetated by natal grass, dog fennel, dwarf horseweed, and ragweed. The water table is generally more than a meter below land surface. Actual ET measurements were derived using the eddy-covariance...
Categories: Data;
Tags: Florida,
Lake Wales Ridge,
Orange County,
USGS Science Data Catalog (SDC),
Water Resources,
The dataset contains the analytical results for quality-control samples collected during the surface-water sampling for the Triangle Area Water Supply Monitoring Project. The data are sampling-vehicle (ambient) blanks and field blanks collected during October 2013 through September 2015. Several study sites contained in this dataset were sampled for other USGS projects during the same time frame. Unless the quality-control samples at these sites were collected in conjunction with the Triangle Area Water Supply Monitoring Project, the data for other projects are not included in the dataset.
We conducted a radio telemetry study of adult western spadefoots (Spea hammondii) at 2 sites in southern California to characterize their survival, behavior, and movements from breeding through aestivation to inform conservation and management for the species. These data support the following publication: Halstead, B.J., Baumberger, K.L., Backlin, A.R., Kleeman, P.M., Wong, M.N., Gallegos, E.A., Rose, J.P., and Fisher, R.N., 2021. Conservation implications of spatiotemporal variation in the terrestrial ecology of an ephemeral pool-breeding amphibian. The Journal of Wildlife Management.
Categories: Data;
Tags: California,
Orange County,
Southern California,
Spea hammondii,
USGS Science Data Catalog (SDC),
The dataset contains the analytical results for environmental and quality-control replicate sample sets and the computed relative percent differences (RPD) greater than 25 percent for the data collected during the surface-water sampling for the Triangle Area Water Supply Monitoring Project. The data are from samples collected during October 2015 through September 2017. Several study sites contained in this dataset were sampled for other USGS projects during the same time frame. Unless the samples at these sites were collected in conjunction with the Triangle Area Water Supply Monitoring Project, the data for other projects are not included in the dataset.
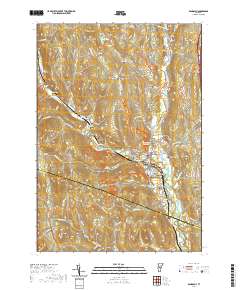
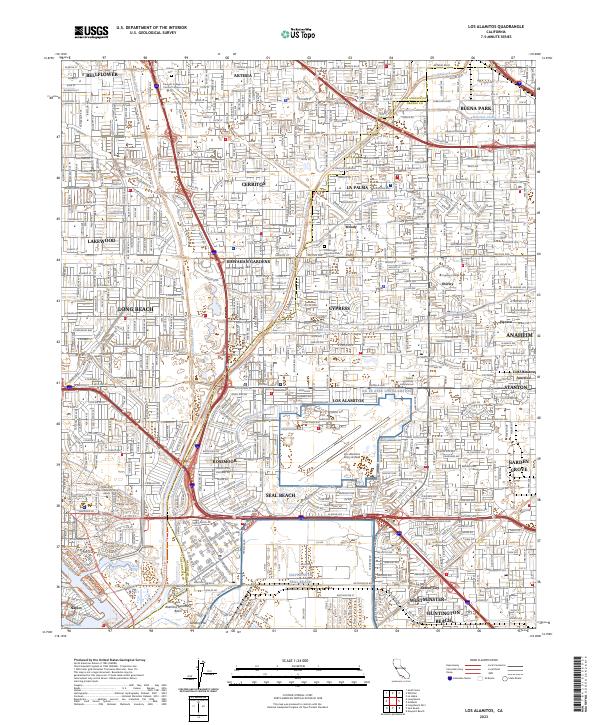
Layered geospatial PDF 7.5 Minute Quadrangle Map. Layers of geospatial data include orthoimagery, roads, grids, geographic names, elevation contours, hydrography, and other selected map features. This map is derived from GIS (geospatial information system) data. It represents a repackaging of GIS data in traditional map form, not creation of new information. The geospatial data in this map are from selected National Map data holdings and other government sources.
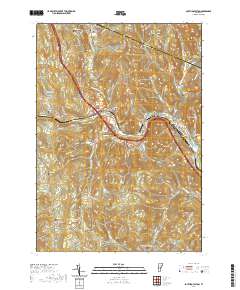
Layered geospatial PDF 7.5 Minute Quadrangle Map. Layers of geospatial data include orthoimagery, roads, grids, geographic names, elevation contours, hydrography, and other selected map features. This map is derived from GIS (geospatial information system) data. It represents a repackaging of GIS data in traditional map form, not creation of new information. The geospatial data in this map are from selected National Map data holdings and other government sources.
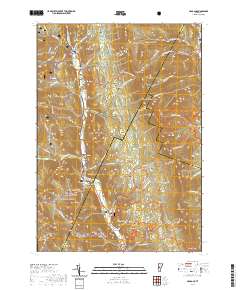
Layered geospatial PDF 7.5 Minute Quadrangle Map. Layers of geospatial data include orthoimagery, roads, grids, geographic names, elevation contours, hydrography, and other selected map features. This map is derived from GIS (geospatial information system) data. It represents a repackaging of GIS data in traditional map form, not creation of new information. The geospatial data in this map are from selected National Map data holdings and other government sources.
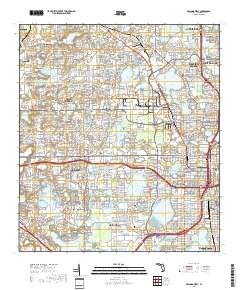
Layered geospatial PDF 7.5 Minute Quadrangle Map. Layers of geospatial data include orthoimagery, roads, grids, geographic names, elevation contours, hydrography, and other selected map features. This map is derived from GIS (geospatial information system) data. It represents a repackaging of GIS data in traditional map form, not creation of new information. The geospatial data in this map are from selected National Map data holdings and other government sources.
Layered geospatial PDF 7.5 Minute Quadrangle Map. Layers of geospatial data include orthoimagery, roads, grids, geographic names, elevation contours, hydrography, and other selected map features. This map is derived from GIS (geospatial information system) data. It represents a repackaging of GIS data in traditional map form, not creation of new information. The geospatial data in this map are from selected National Map data holdings and other government sources.
Layered geospatial PDF 7.5 Minute Quadrangle Map. Layers of geospatial data include orthoimagery, roads, grids, geographic names, elevation contours, hydrography, and other selected map features. This map is derived from GIS (geospatial information system) data. It represents a repackaging of GIS data in traditional map form, not creation of new information. The geospatial data in this map are from selected National Map data holdings and other government sources.
Layered geospatial PDF 7.5 Minute Quadrangle Map. Layers of geospatial data include orthoimagery, roads, grids, geographic names, elevation contours, hydrography, and other selected map features. This map is derived from GIS (geospatial information system) data. It represents a repackaging of GIS data in traditional map form, not creation of new information. The geospatial data in this map are from selected National Map data holdings and other government sources.
Layered geospatial PDF 7.5 Minute Quadrangle Map. Layers of geospatial data include orthoimagery, roads, grids, geographic names, elevation contours, hydrography, and other selected map features. This map is derived from GIS (geospatial information system) data. It represents a repackaging of GIS data in traditional map form, not creation of new information. The geospatial data in this map are from selected National Map data holdings and other government sources.
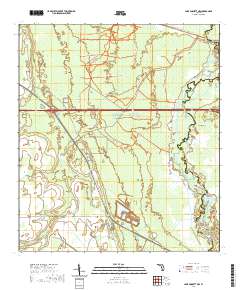
Layered geospatial PDF 7.5 Minute Quadrangle Map. Layers of geospatial data include orthoimagery, roads, grids, geographic names, elevation contours, hydrography, and other selected map features. This map is derived from GIS (geospatial information system) data. It represents a repackaging of GIS data in traditional map form, not creation of new information. The geospatial data in this map are from selected National Map data holdings and other government sources.
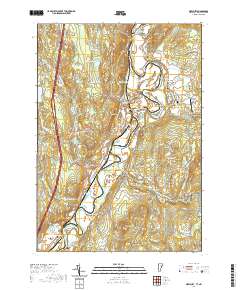
Layered geospatial PDF 7.5 Minute Quadrangle Map. Layers of geospatial data include orthoimagery, roads, grids, geographic names, elevation contours, hydrography, and other selected map features. This map is derived from GIS (geospatial information system) data. It represents a repackaging of GIS data in traditional map form, not creation of new information. The geospatial data in this map are from selected National Map data holdings and other government sources.
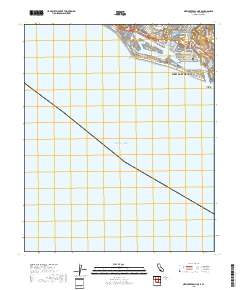
Layered geospatial PDF 7.5 Minute Quadrangle Map. Layers of geospatial data include orthoimagery, roads, grids, geographic names, elevation contours, hydrography, and other selected map features. This map is derived from GIS (geospatial information system) data. It represents a repackaging of GIS data in traditional map form, not creation of new information. The geospatial data in this map are from selected National Map data holdings and other government sources.
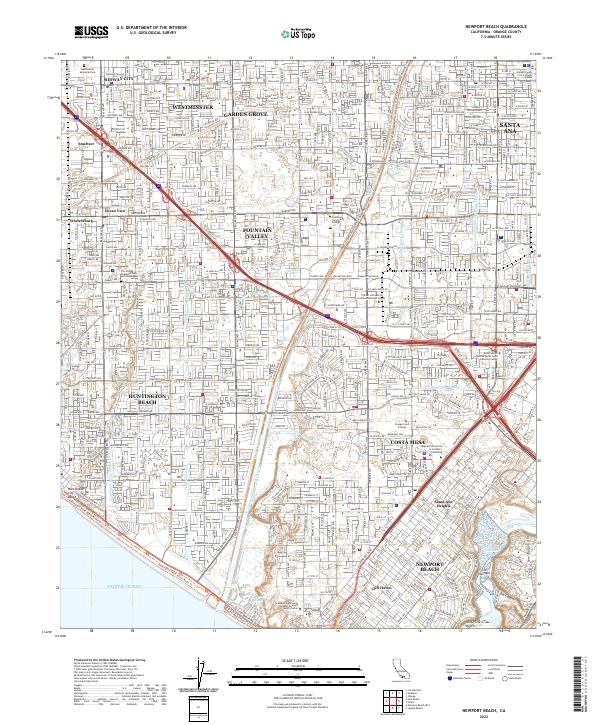
Layered geospatial PDF 7.5 Minute Quadrangle Map. Layers of geospatial data include orthoimagery, roads, grids, geographic names, elevation contours, hydrography, and other selected map features. This map is derived from GIS (geospatial information system) data. It represents a repackaging of GIS data in traditional map form, not creation of new information. The geospatial data in this map are from selected National Map data holdings and other government sources.

Layered geospatial PDF 7.5 Minute Quadrangle Map. Layers of geospatial data include orthoimagery, roads, grids, geographic names, elevation contours, hydrography, and other selected map features. This map is derived from GIS (geospatial information system) data. It represents a repackaging of GIS data in traditional map form, not creation of new information. The geospatial data in this map are from selected National Map data holdings and other government sources.
Layered geospatial PDF 7.5 Minute Quadrangle Map. Layers of geospatial data include orthoimagery, roads, grids, geographic names, elevation contours, hydrography, and other selected map features. This map is derived from GIS (geospatial information system) data. It represents a repackaging of GIS data in traditional map form, not creation of new information. The geospatial data in this map are from selected National Map data holdings and other government sources.
|

|
