Filters: Tags: PNW (X)
148 results (72ms)|
Filters
Date Range
Extensions Types
Contacts
Categories Tag Types
|

These data were released prior to the October 1, 2016 effective date for the USGS’s policy dictating the review, approval, and release of scientific data as referenced in USGS Survey Manual Chapter 502.8 Fundamental Science Practices: Review and Approval of Scientific Data for Release. This spatial data set was created by the U.S. Geological Survey (USGS) to represent the amount of phosphorus generated at confined cattle operations that was applied to nearby farm land in the Pacific Northwest region of the United States (Hydro Region 17; Major River Basin 7 (MRB7)) during 2002.

These data were released prior to the October 1, 2016 effective date for the USGS’s policy dictating the review, approval, and release of scientific data as referenced in USGS Survey Manual Chapter 502.8 Fundamental Science Practices: Review and Approval of Scientific Data for Release. This spatial data set was created by the U.S. Geological Survey (USGS) to represent the amount of nitrogen and phosphorus that was generated by livestock and applied to land in the Pacific Northwest region of the United States (Hydro Region 17; Major River Basin 7 (MRB7)) during 2002 within each incremental watershed delineated in the NHDPlus v2 dataset.

These data were released prior to the October 1, 2016 effective date for the USGS’s policy dictating the review, approval, and release of scientific data as referenced in USGS Survey Manual Chapter 502.8 Fundamental Science Practices: Review and Approval of Scientific Data for Release. This spatial data set was created by the U.S. Geological Survey (USGS) to represent populations that did not have access to municipal sewer service in the Pacific Northwest region of the United States (Hydro Region 17; Major River Basin 7 (MRB7)) in 2002.

These data were released prior to the October 1, 2016 effective date for the USGS’s policy dictating the review, approval, and release of scientific data as referenced in USGS Survey Manual Chapter 502.8 Fundamental Science Practices: Review and Approval of Scientific Data for Release. This spatial data set was created by the U.S. Geological Survey (USGS) to represent the amount of fertilizer phosphorus that was applied to farm land in the Pacific Northwest region of the United States (Hydro Region 17; Major River Basin 7 (MRB7)) during 2002.
A combination of remote sensing and ecosystem modeling is used to examine the trends in NEP and net ecosystem carbon balance (NECB) in this region over the 1985 - 2007 period, with particular attention to land ownership since management now differs widely between public and private forestland. In the late 1980s, forestland in both ownership classes was subject to high rates of harvesting, and consequently the land was a carbon source (i.e. had a negative NECB). After the policy driven reduction in the harvest level, public forestland became a large carbon sink driven in part by increasing NEP whereas private forestland was close to carbon neutral.
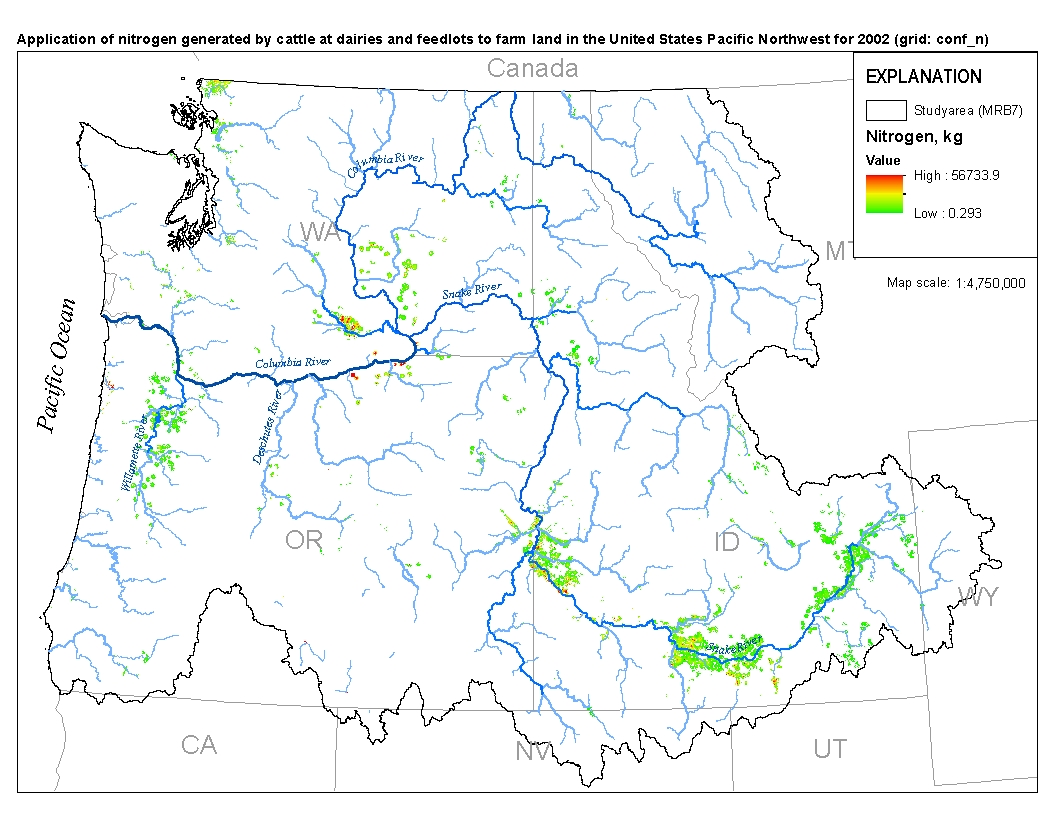
This spatial data set was created by the U.S. Geological Survey (USGS) to represent the amount of nitrogen generated at confined cattle operations that was applied to nearby farm land in the Pacific Northwest region of the United States (Hydro Region 17; Major River Basin 7 (MRB7)) during 2002.

A combination of remote sensing and ecosystem modeling is used to examine the trends in NEP and net ecosystem carbon balance (NECB) in this region over the 1985–2007 period, with particular attention to land ownership since management now differs widely between public and private forestland. In the late 1980s, forestland in both ownership classes was subject to high rates of harvesting, and consequently the land was a carbon source (i.e. had a negative NECB). After the policy driven reduction in the harvest level, public forestland became a large carbon sink driven in part by increasing NEP whereas private forestland was close to carbon neutral.

Annual average wind resource potential of the northwestern United States at a 50 meter height. Available from the National Renewable Energy Laboratory (NREL) at http://www.nrel.gov/renewable_resources/ . This dataset was last updated on 1/24/2011.

For his MS thesis, Brendan Rogers used the vegetation model MC1 to simulate vegetation dynamics, associated carbon and nitrogen cycle, water budget and wild fire impacts across the western 2/3 of the states of Oregon and Washington using climate input data from the the PRISM group (Chris Daly, OSU) at a 30arc second (800m) spatial grain. The model was run from 1895 to 2100 assuming that nitrogen demand from the plants was always met so that the nitrogen concentrations in various plant parts never dropped below their minimum reported values. A CO2 enhancement effect increased productivity and water use efficiency as the atmospheric CO2 concentration increased. Future climate change scenarios were generated through...

Gridded information on NPP is derived from NASAâs MODIS satellite data in a 10 km2 grid cell resolution based on monthly values averaged for 2010 in gC m-2 day-1. Data were transformed to a standardized scale based on their maximum values. Hence, all values range between 0 and 1.

A warming climate could profoundly affect the distribution and abundance of many fishes. Bull trout (Salvelinus confluentus) may be especially vulnerable to climate change given that spawning and early rearing are constrained by cold water temperatures creating a patchwork of natal headwater habitats across river networks. Because the size and connectivity of patches also appear to influence the persistence of local populations, climate warming could lead to increasing fragmentation of remaining habitats and accelerated decline of this species. We modeled the relationships between (1) the lower elevation limits of small bull trout and mean annual air temperature and (2) latitude and longitude across the species...

For his MS thesis, Brendan Rogers used the vegetation model MC1 to simulate vegetation dynamics, associated carbon and nitrogen cycle, water budget and wild fire impacts across the western 2/3 of the states of Oregon and Washington using climate input data from the PRISM group (Chris Daly, OSU) at a 30arc second (800m) spatial grain. The model was run from 1895 to 2100 assuming that nitrogen demand from the plants was always met so that the nitrogen concentrations in various plant parts never dropped below their minimum reported values. A CO2 enhancement effect increased productivity and water use efficiency as the atmospheric CO2 concentration increased. Future climate change scenarios were generated through statistical...
For his MS thesis, Brendan Rogers used the vegetation model MC1 to simulate vegetation dynamics, associated carbon and nitrogen cycle, water budget and wild fire impacts across the western 2/3 of the states of Oregon and Washington using climate input data from the PRISM group (Chris Daly, OSU) at a 30arc second (800m) spatial grain. The model was run from 1895 to 2100 assuming that nitrogen demand from the plants was always met so that the nitrogen concentrations in various plant parts never dropped below their minimum reported values. A CO2 enhancement effect increased productivity and water use efficiency as the atmospheric CO2 concentration increased. Future climate change scenarios were generated through statistical...

For his MS thesis, Brendan Rogers used the vegetation model MC1 to simulate vegetation dynamics, associated carbon and nitrogen cycle, water budget and wild fire impacts across the western 2/3 of the states of Oregon and Washington using climate input data from the PRISM group (Chris Daly, OSU) at a 30arc second (800m) spatial grain. The model was run from 1895 to 2100 assuming that nitrogen demand from the plants was always met so that the nitrogen concentrations in various plant parts never dropped below their minimum reported values. A CO2 enhancement effect increased productivity and water use efficiency as the atmospheric CO2 concentration increased. Future climate change scenarios were generated through statistical...
This layer depicts the total volume of timber harvested in 2010 measured in thousands of board feet. Derived tabular data are based on the county level. Data were transformed to a standardized scale based on their maximum values. Hence, all values range between 0 and 1.

These data were released prior to the October 1, 2016 effective date for the USGS’s policy dictating the review, approval, and release of scientific data as referenced in USGS Survey Manual Chapter 502.8 Fundamental Science Practices: Review and Approval of Scientific Data for Release. This spatial data set was created by the U.S. Geological Survey (USGS) to represent the amount of atmospheric nitrogen deposition in the Pacific Northwest region of the United States (Hydro Region 17; Major River Basin 7 (MRB7)) during 2002 within each incremental watershed delineated in the NHDPlus v2 dataset.

Application of fertilizer phosphorus to nonfarm land in the United States Pacific Northwest for 2002
These data were released prior to the October 1, 2016 effective date for the USGS’s policy dictating the review, approval, and release of scientific data as referenced in USGS Survey Manual Chapter 502.8 Fundamental Science Practices: Review and Approval of Scientific Data for Release. This spatial data set was created by the U.S. Geological Survey (USGS) to represent the amount of fertilizer phosphorus that was applied to nonfarm land in the Pacific Northwest region of the United States (Hydro Region 17; Major River Basin 7 (MRB7)) during 2002.

These data were released prior to the October 1, 2016 effective date for the USGS’s policy dictating the review, approval, and release of scientific data as referenced in USGS Survey Manual Chapter 502.8 Fundamental Science Practices: Review and Approval of Scientific Data for Release. This spatial data set was created by the U.S. Geological Survey (USGS) to represent the amount of fertilizer nitrogen that was applied to farm land in the Pacific Northwest region of the United States (Hydro Region 17; Major River Basin 7 (MRB7)) during 2002.
For his MS thesis, Brendan Rogers used climate data from the PRISM group (Chris Daly, Oregon State University) at a 30arc second (800m) spatial grain across the western 2/3 of the states of Oregon and Washington to generate a climatology or baseline. He then created future climate change scenarios using statistical downscaling to create anomalies from three General Circulation Models (CSIRO Mk3, MIROC 3.2 medres, and Hadley CM 3), each run through three CO2 emission scenarios (SRES B1, A1B, and A2).
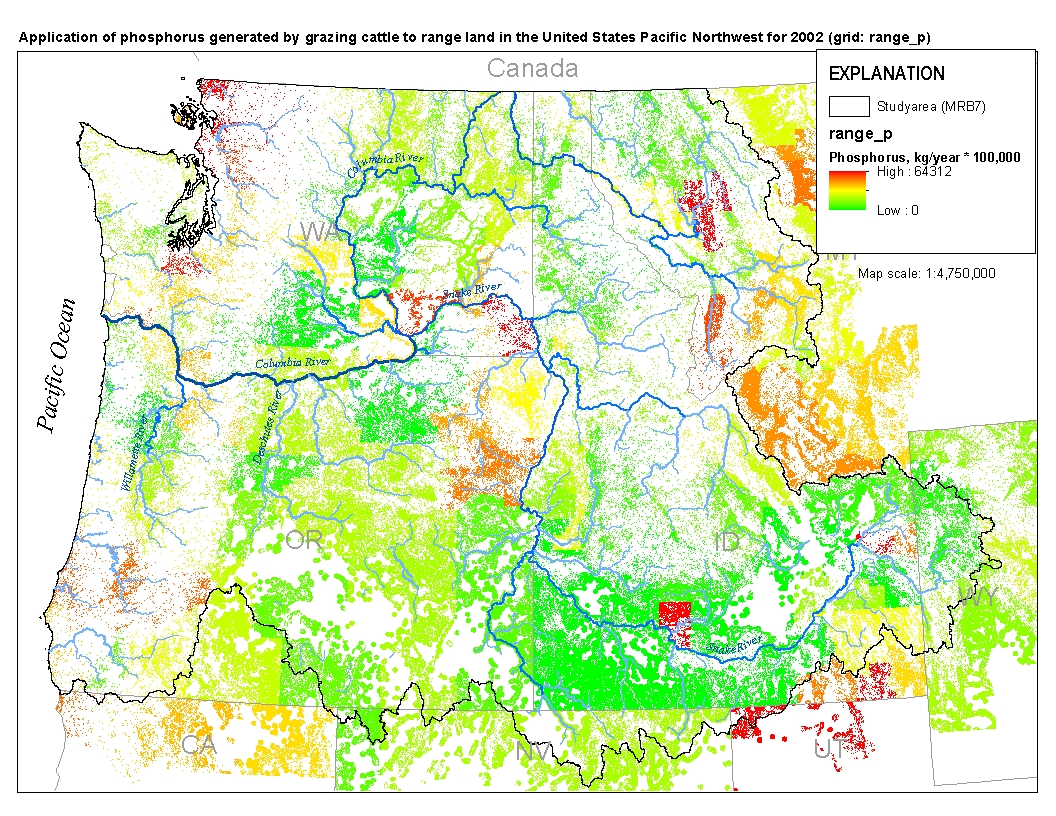
This spatial data set was created by the U.S. Geological Survey (USGS) to represent the amount of phosphorus generated by grazing cattle that was applied to range land in the Pacific Northwest region of the United States (Hydro Region 17; Major River Basin 7 (MRB7)) during 2002.
|

|
